Dutch Bros Results Presentation Deck
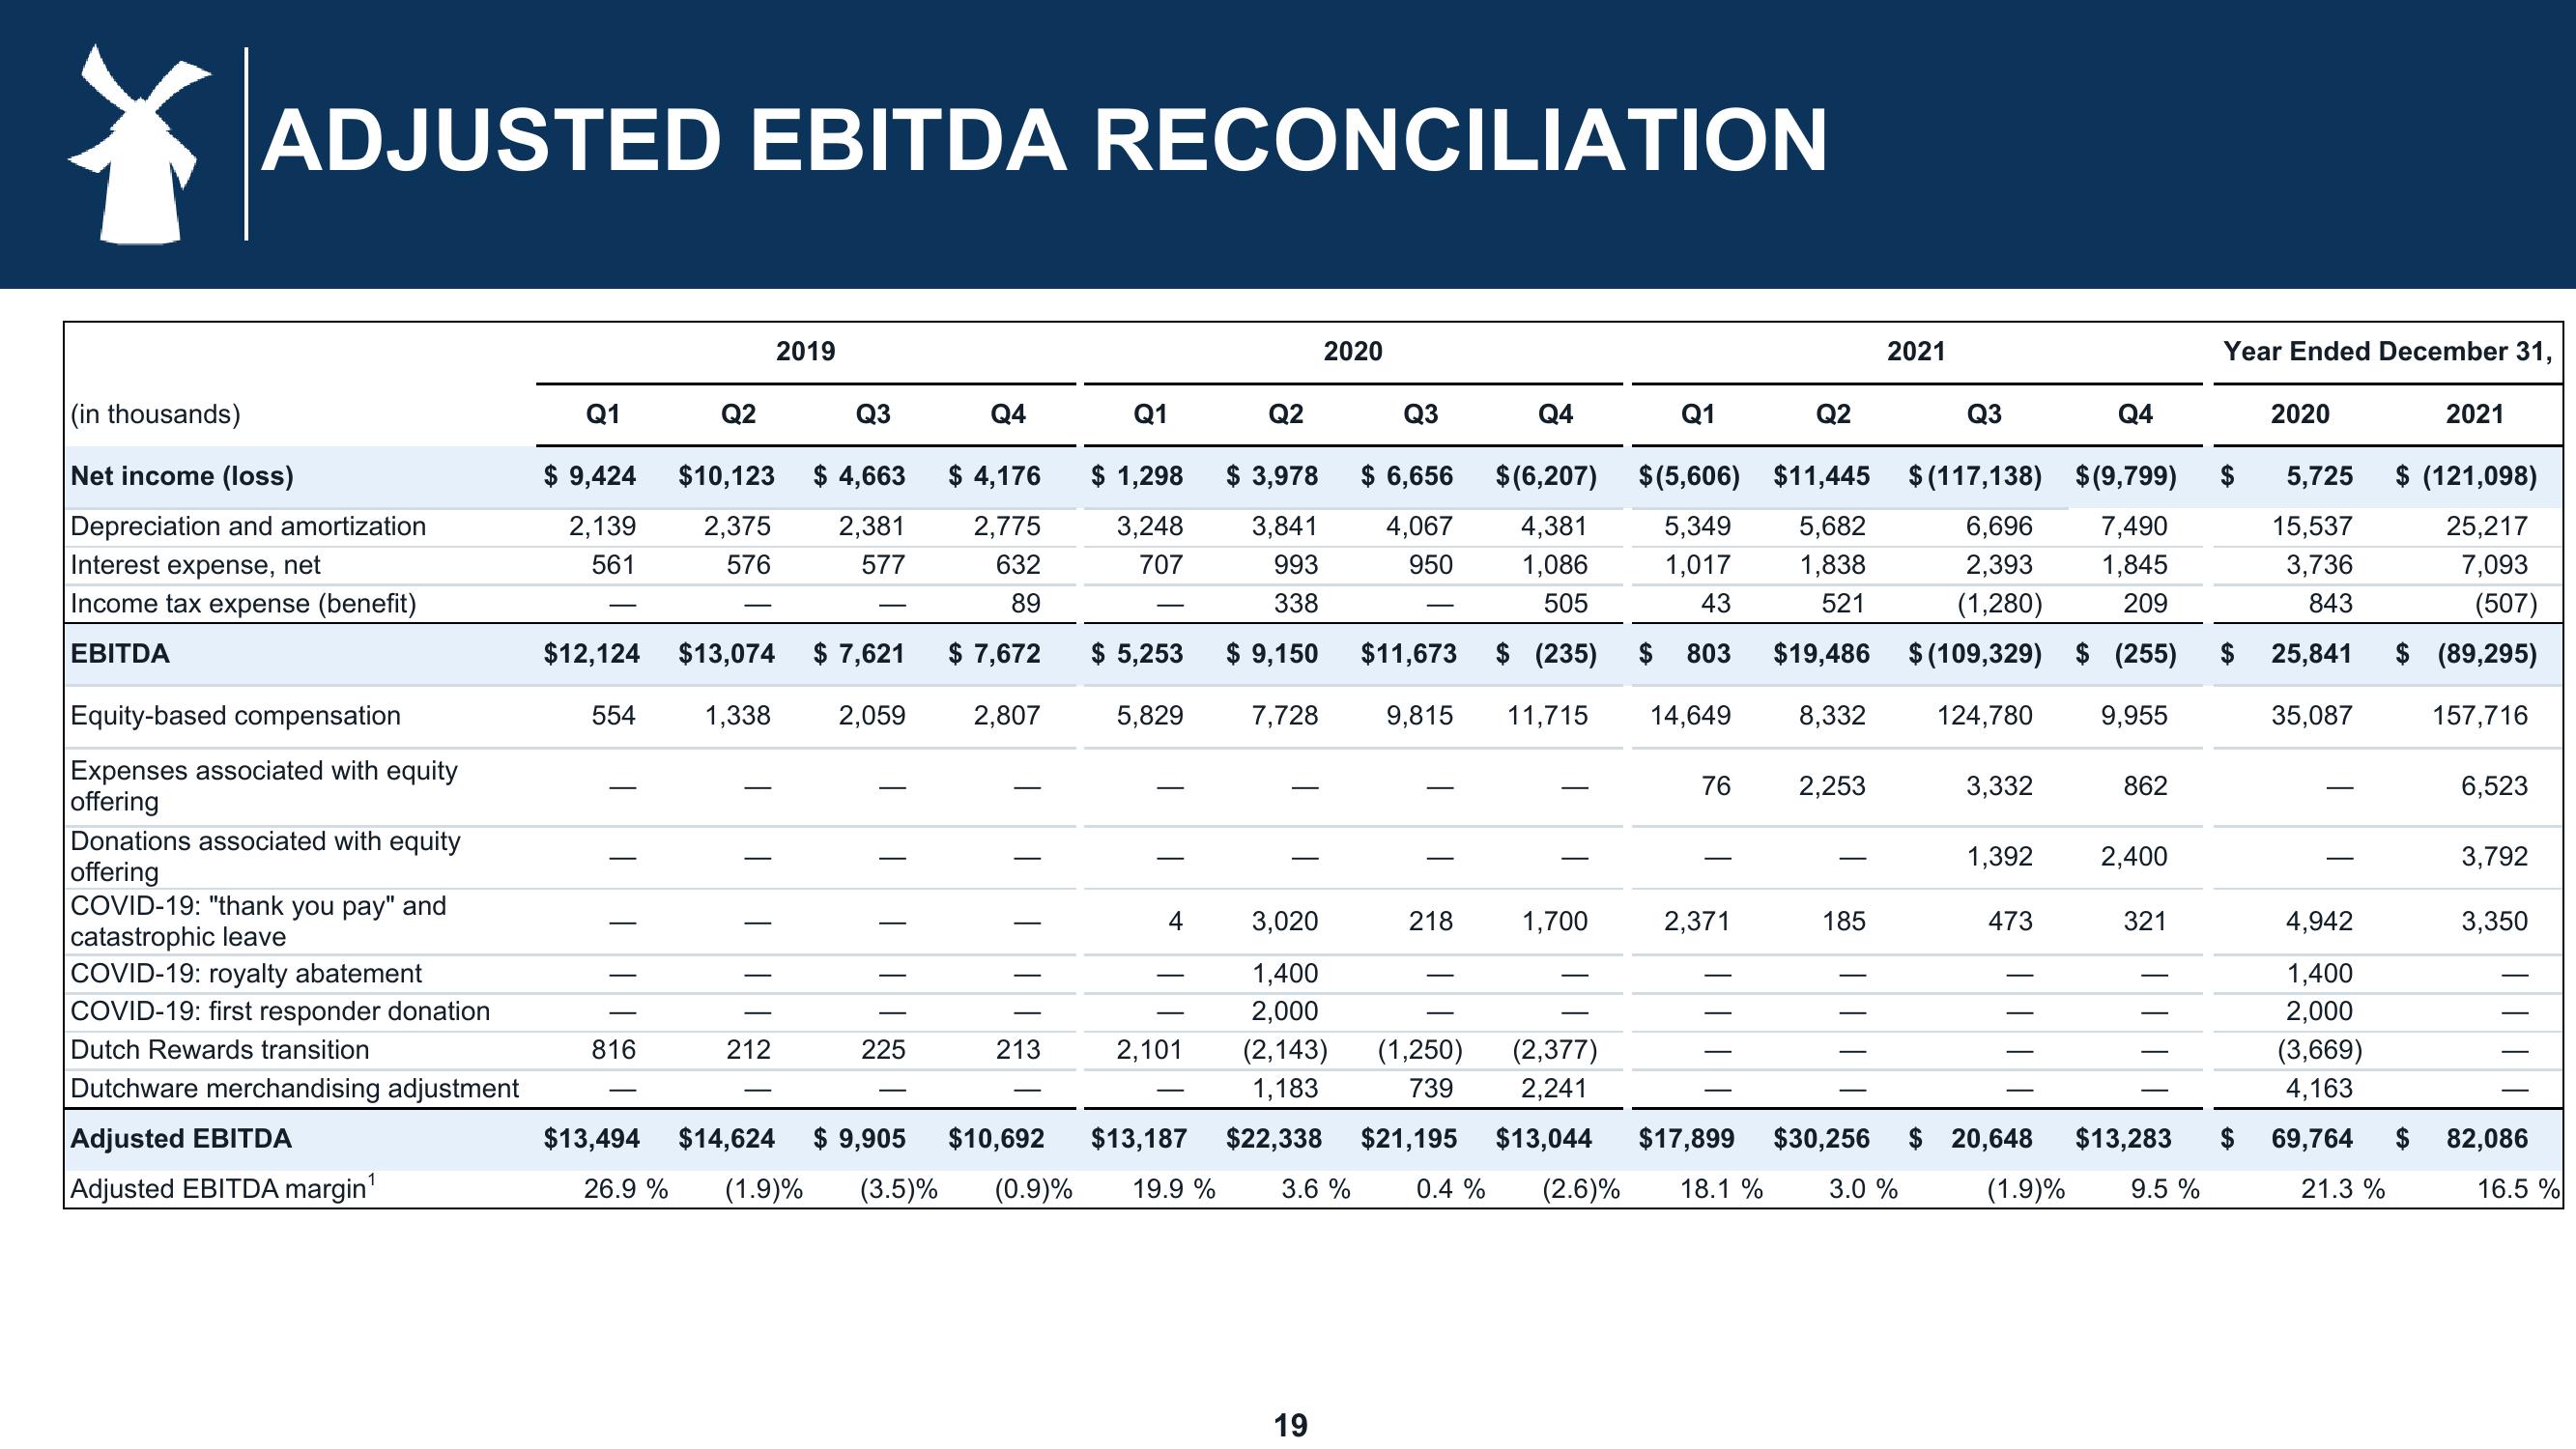
ADJUSTED EBITDA RECONCILIATION
(in thousands)
Net income (loss)
Depreciation and amortization
Interest expense, net
Income tax expense (benefit)
EBITDA
Equity-based compensation
Expenses associated with equity
offering
Donations associated with equity
offering
COVID-19: "thank you pay" and
catastrophic leave
COVID-19: royalty abatement
COVID-19: first responder donation
Dutch Rewards transition
Dutchware merchandising adjustment
Adjusted EBITDA
Adjusted EBITDA margin¹
Q1
$ 9,424
2,139
561
554
$12,124 $13,074
||||
Q2
816
$10,123
2,375
576
1,338
||||
212
2019
Q3
$ 4,663
2,381
577
$ 7,621
2,059
225
Q4
$ 4,176
2,775
632
89
$ 7,672
2,807
213
Q1
$ 1,298
3,248
707
$ 5,253
5,829
4
2,101
$13,494 $14,624 $ 9,905 $10,692 $13,187
26.9% (1.9)% (3.5)% (0.9)% 19.9 %
Q2
$ 3,978
3,841
993
338
$ 9,150
7,728
2020
19
Q3
$ 6,656
4,067
950
218
Q4
$11,673
9,815 11,715 14,649
Q1
Q2
Q3
Q4
5,725
15,537
$ (6,207) $(5,606) $11,445 $(117,138) $(9,799)
4,381 5,349
7,490
1,086 1,017
1,845
3,736
505
43
209
843
(235) $ 803
(255) $ 25,841
9,955
35,087
5,682
1,838
521
$19,486
6,696
2,393
(1,280)
$ (109,329)
124,780
3,020
1,400
2,000
(2,143) (1,250) (2,377)
1,183
739 2,241
$22,338 $21,195 $13,044
3.6 % 0.4 % (2.6)% 18.1 %
76
1,700
2,371
8,332
2,253
2021
185
3,332
1,392
473
$17,899 $30,256 $ 20,648
3.0 %
(1.9)%
862
2,400
Year Ended December 31,
321
$13,283 $
9.5 %
2020
2021
$ (121,098)
25,217
7,093
(507)
(89,295)
157,716
4,942
1,400
2,000
(3,669)
4,163
69,764 $
21.3 %
6,523
3,792
3,350
82,086
16.5 %View entire presentation