Tudor, Pickering, Holt & Co Investment Banking
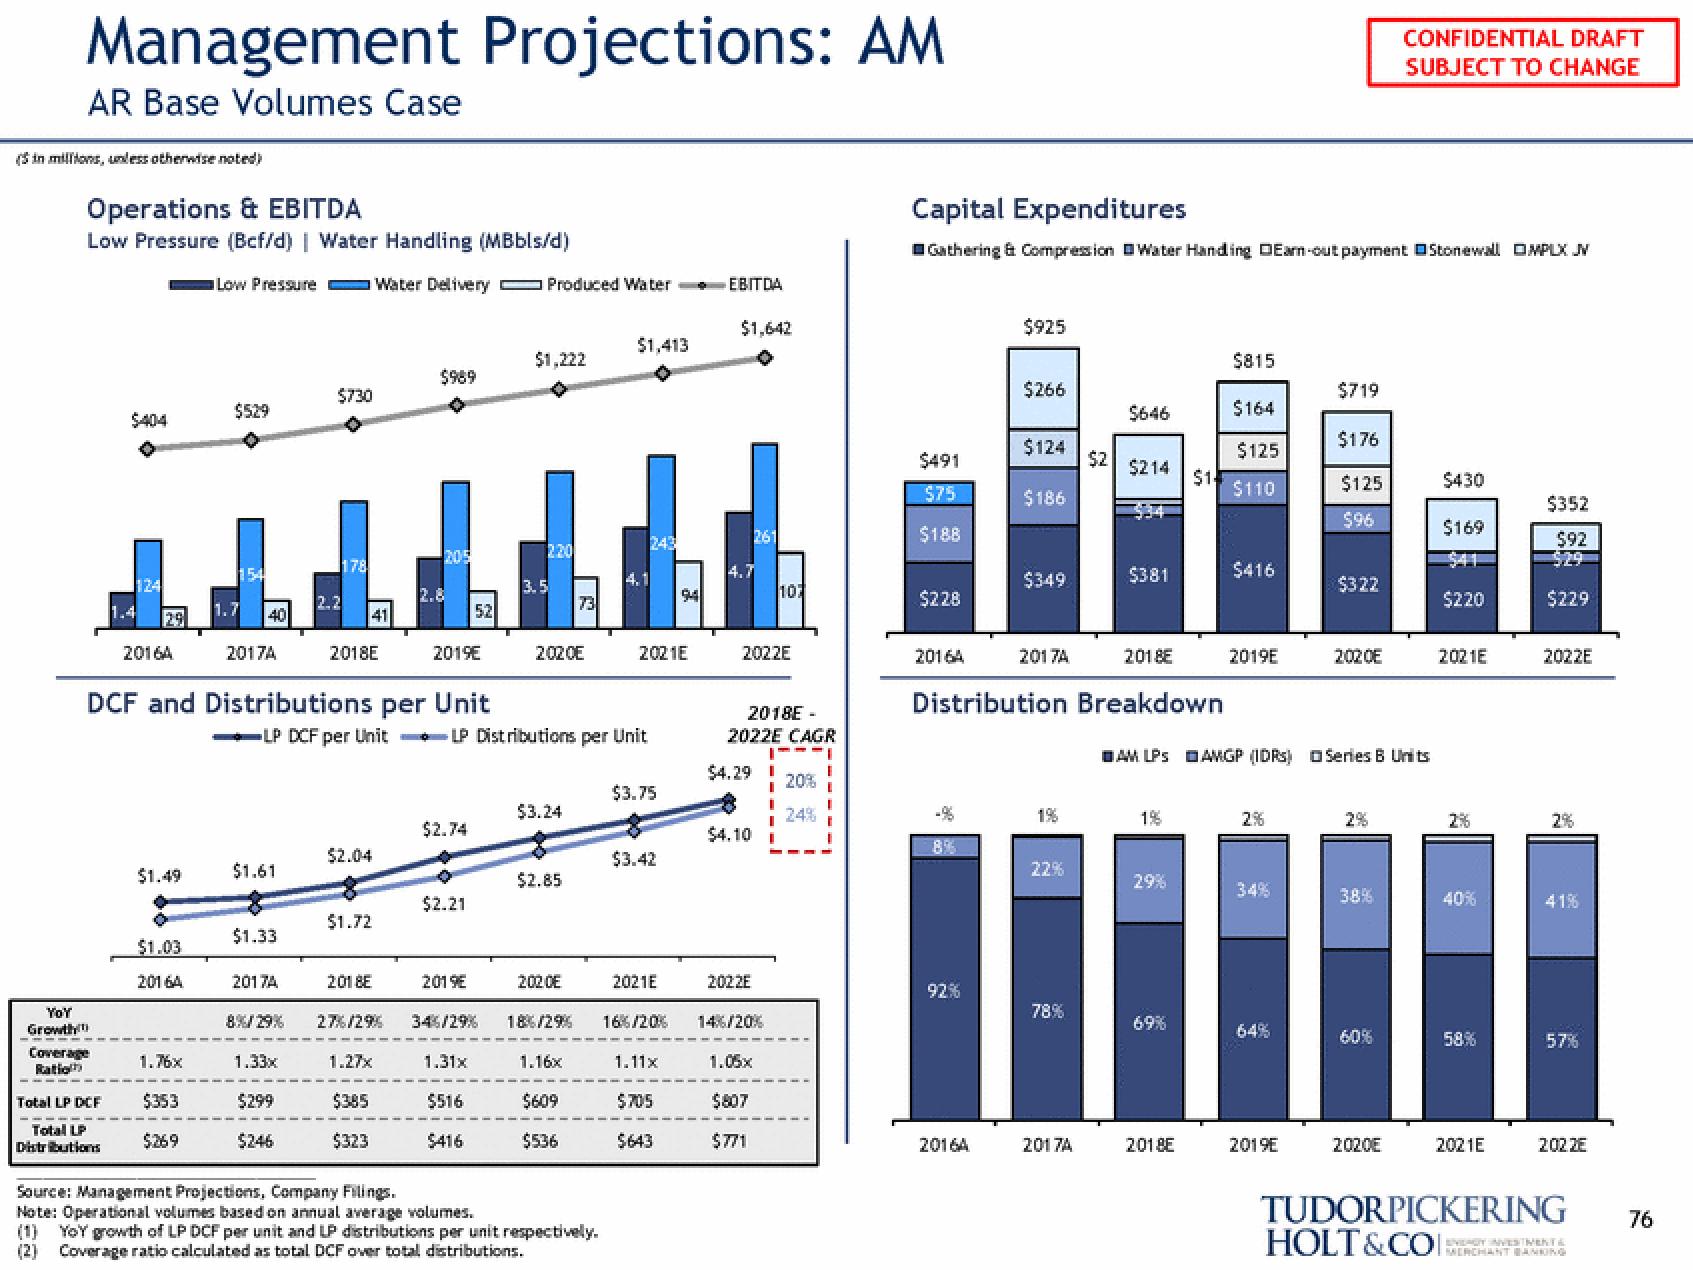
Management Projections: AM
AR Base Volumes Case
(in millions, unless otherwise noted)
YOY
Growth
Operations & EBITDA
Low Pressure (Bcf/d) | Water Handling (MBbls/d)
Coverage
Ratio
$404
Total LP DCF
Total LP
Distributions
124
1.4
2016A
$1.49
$1.03
20164
1.76x
Low Pressure Water Delivery Produced Water EBITDA
$1,642
$353
$269
$529
40
2017A
$1.61
$1.33
T
DCF and Distributions per Unit
LP DCF per Unit
$730
2017A
178
41
2018E
$2.04
$1.72
2018E
8%/29% 27%/29%
1.33x
$299
$246
$989
1.27x
$385
$323
205
2019E
52
$2.74
$2.21
$1,222
2019€
34%/29%
1.31x
$516
$416
220
3.5
2020E
LP Distributions per Unit
$3.24
$2.85
202.0E
18%/29%
73
1.16x
$609
$536
$1,413
Source: Management Projections, Company Filings.
Note: Operational volumes based on annual average volumes.
YoY growth of LP DCF per unit and LP distributions per unit respectively.
(2) Coverage ratio calculated as total DCF over total distributions.
243
2021E
$3.75
$3.42
2021E
16%/20%
1.11x
94
$705
$643
4.7
2022E
2018E -
2022E CAGR
$4.29 I
$4.10 I
2022E
14%/20%
107
1.05x
$807
$771
I
20% I
E
Capital Expenditures
Gathering & Compression Water Handing DEam-out payment Stonewall OMPLX JV
$491
$75
$188
$228
2016A
92%
$925
2016A
$266
$124
$186
$349
2017A
22%
78%
$646
Distribution Breakdown
2017A
$2 $214
$381
2018
1%
29%
$15
69%
2018E
$815
$164
$125
$110
$416
2019E
AM LPS AMGP (IDRS) □ Series B Units
2%
64%
$719
2019E
$176
$125
$96
$322
2020E
38%
CONFIDENTIAL DRAFT
SUBJECT TO CHANGE
60%
2020E
$430
$169
$220
2021E
40%
58%
2021E
$352
$92
$229
2022E
2%
41%
57%
202 ZE
TUDORPICKERING
HOLT&COI:
EVAGY INVESTMENT &
MERCHANT BANKING
76View entire presentation