Ford Investor Conference
Company
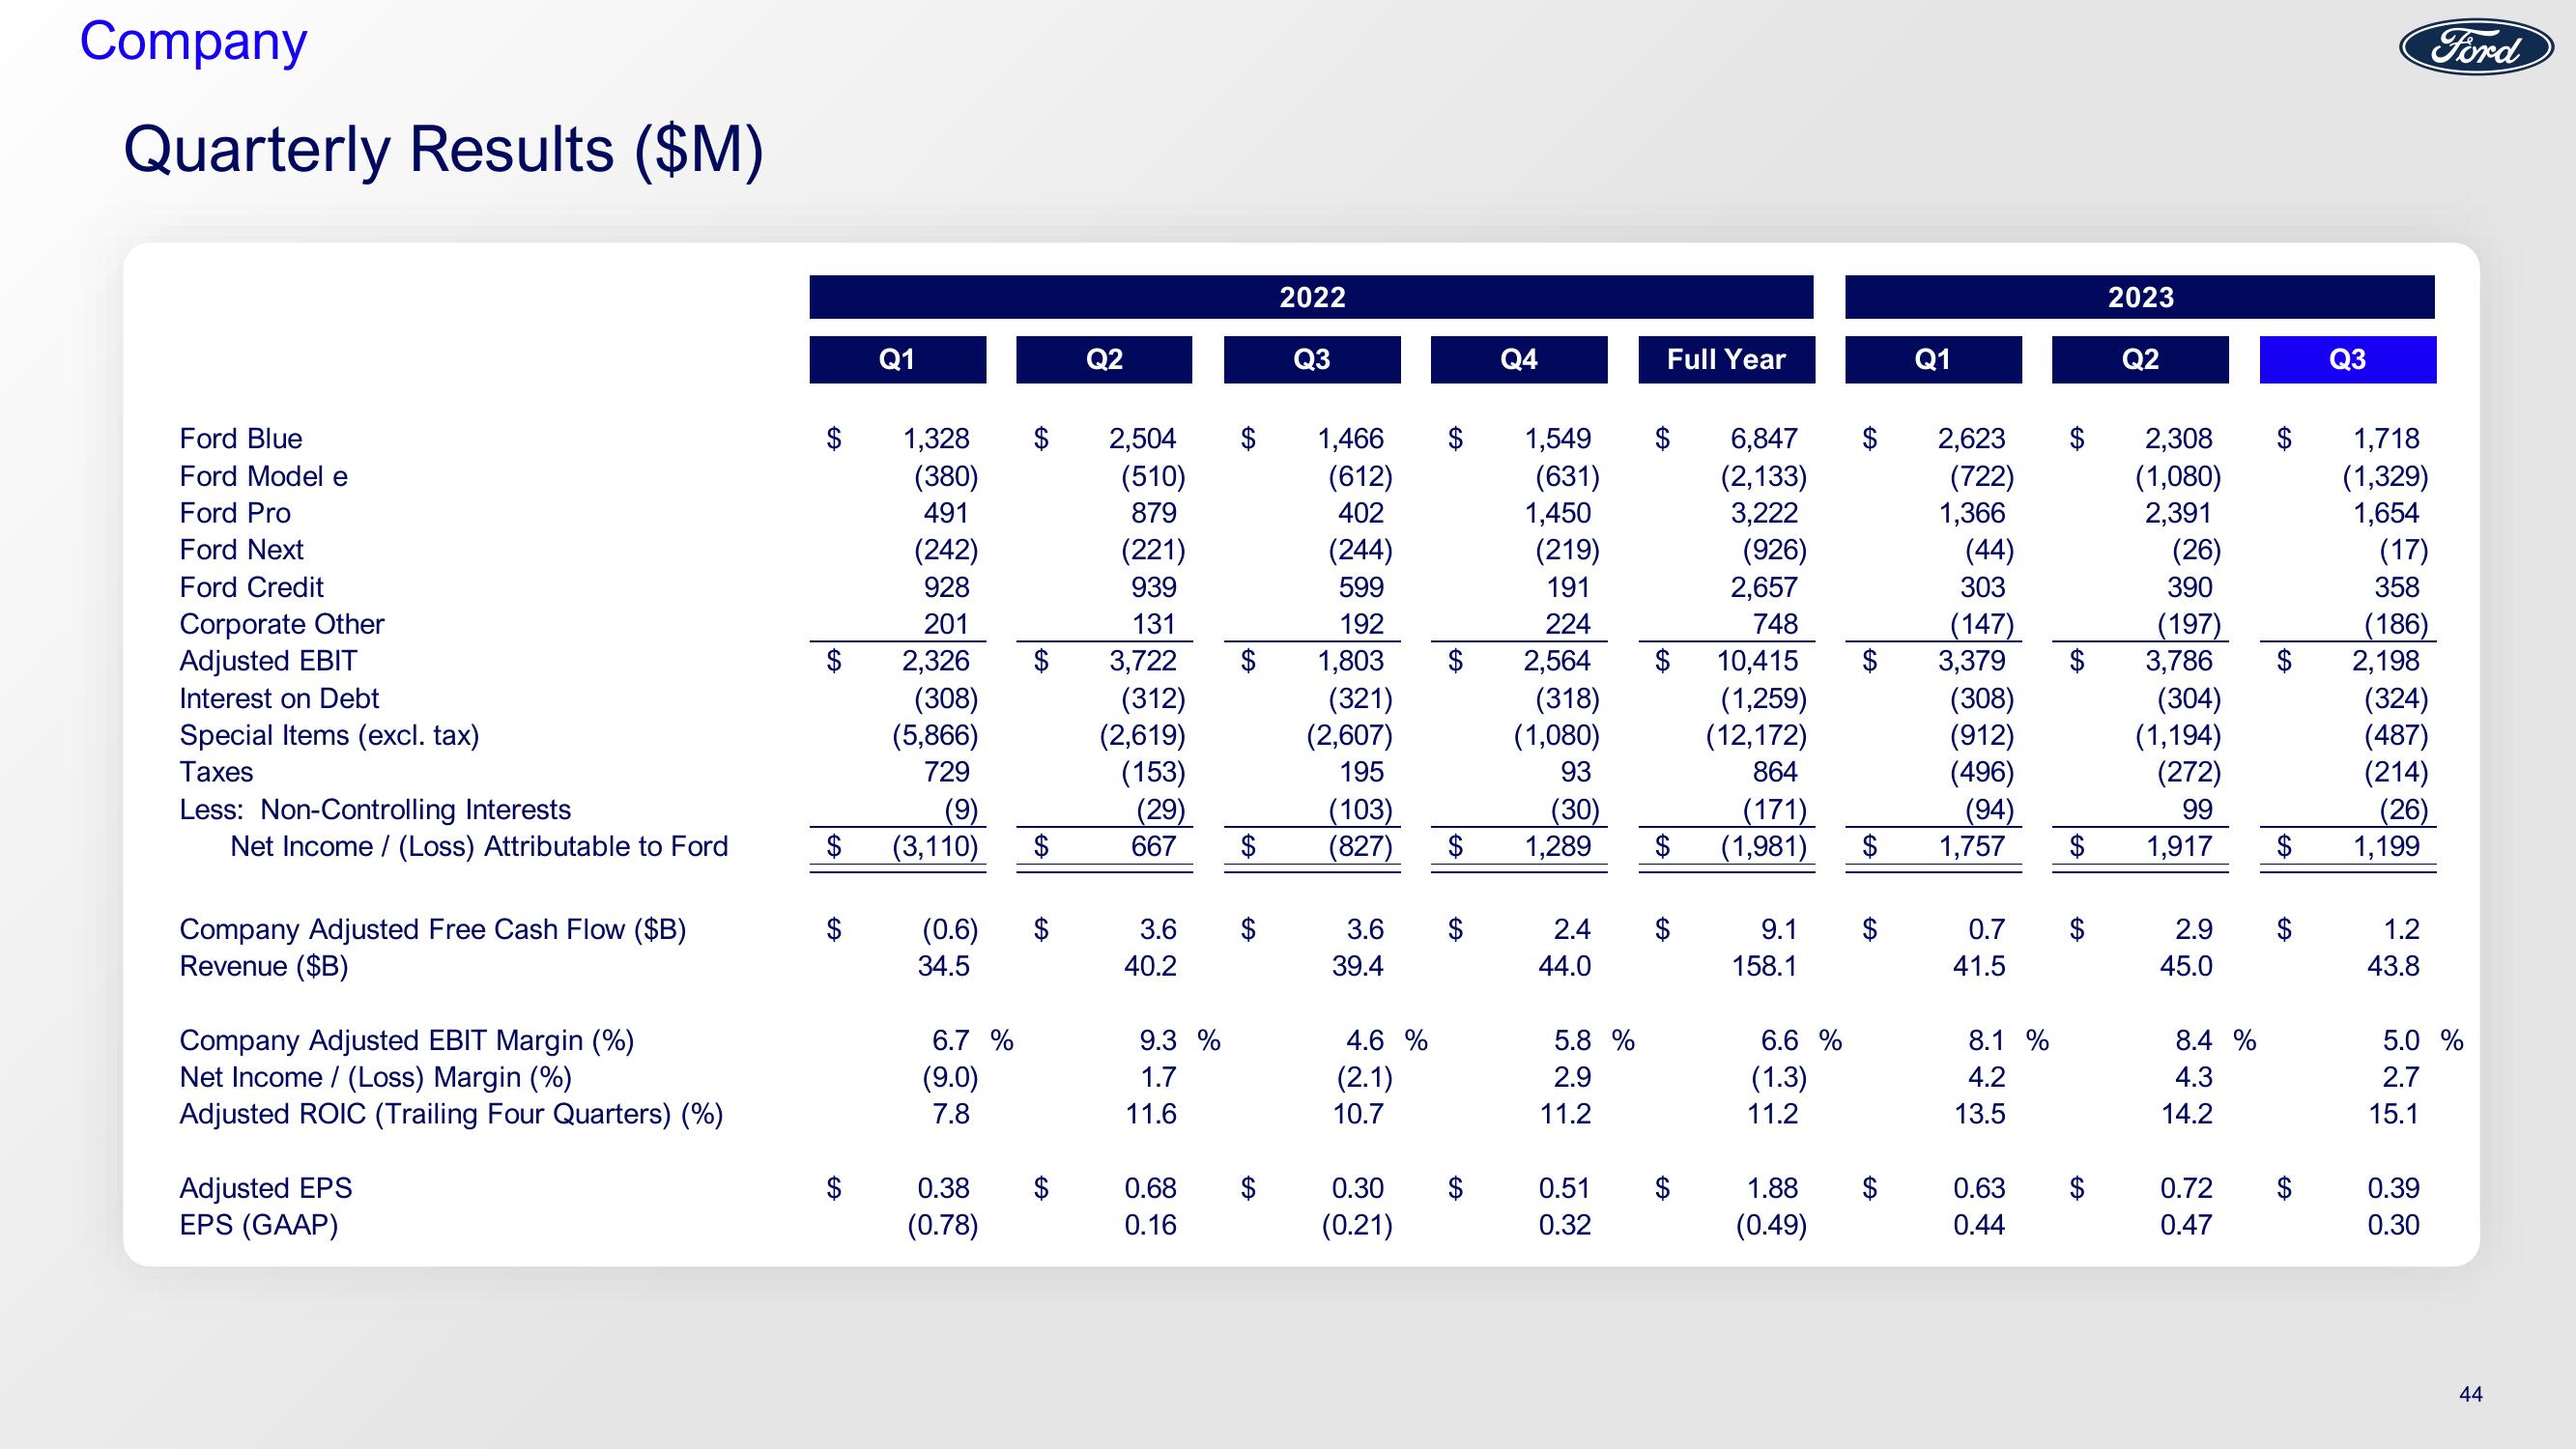
Quarterly Results ($M)
Ford Blue
Ford Model e
Ford Pro
Ford Next
Ford Credit
Corporate Other
Adjusted EBIT
Interest on Debt
Special Items (excl. tax)
Taxes
Less: Non-Controlling Interests
Net Income / (Loss) Attributable to Ford
Company Adjusted Free Cash Flow ($B)
Revenue ($B)
Company Adjusted EBIT Margin (%)
Net Income /(Loss) Margin (%)
Adjusted ROIC (Trailing Four Quarters) (%)
Adjusted EPS
EPS (GAAP)
$
$
$
Q1
1,328
(380)
491
(242)
928
201
2,326
(308)
(5,866)
729
(9)
(3,110)
6.7 %
(0.6) $
34.5
(9.0)
7.8
$
0.38
(0.78)
$
Q2
(221)
939
131
2,504 $ 1,466
(510)
(612)
879
402
3,722
(312)
(2,619)
(153)
(29)
667
3.6
40.2
9.3 %
1.7
11.6
0.68
0.16
2022
$
Q3
(244)
599
192
1,803
(321)
(2,607)
195
(103)
(827)
3.6
39.4
4.6 %
(2.1)
10.7
0.30
(0.21)
$
$
Q4
$
1,549
(631)
$ 2,564
(318)
(1,080)
93
1,450
(219)
191
224
(30)
1,289
5.8 %
2.9
11.2
Full Year
0.51
0.32
$
2.4 $
44.0
$
6,847
(2,133)
3,222
(926)
2,657
748
10,415
(1,259)
(12,172)
864
(171)
(1,981)
9.1
158.1
6.6 %
(1.3)
11.2
1.88
(0.49)
$
Q1
2,623
(722)
1,366
(44)
303
(147)
3,379
(308)
(912)
(496)
(94)
1,757
0.7 $
41.5
8.1 %
4.2
13.5
$
0.63
0.44
SA
2023
Q2
2,308
(1,080)
2,391
(26)
390
(197)
3,786
(304)
(1,194)
(272)
99
1,917
2.9
45.0
8.4 %
4.3
14.2
0.72
0.47
$
$
$
Q3
1,718
(1,329)
1,654
(17)
358
(186)
2,198
(324)
(487)
(214)
(26)
1,199
1.2
43.8
Ford
5.0 %
2.7
15.1
0.39
0.30
44View entire presentation