Faraday Future SPAC Presentation Deck
I
I
I
I
I
T
I
I
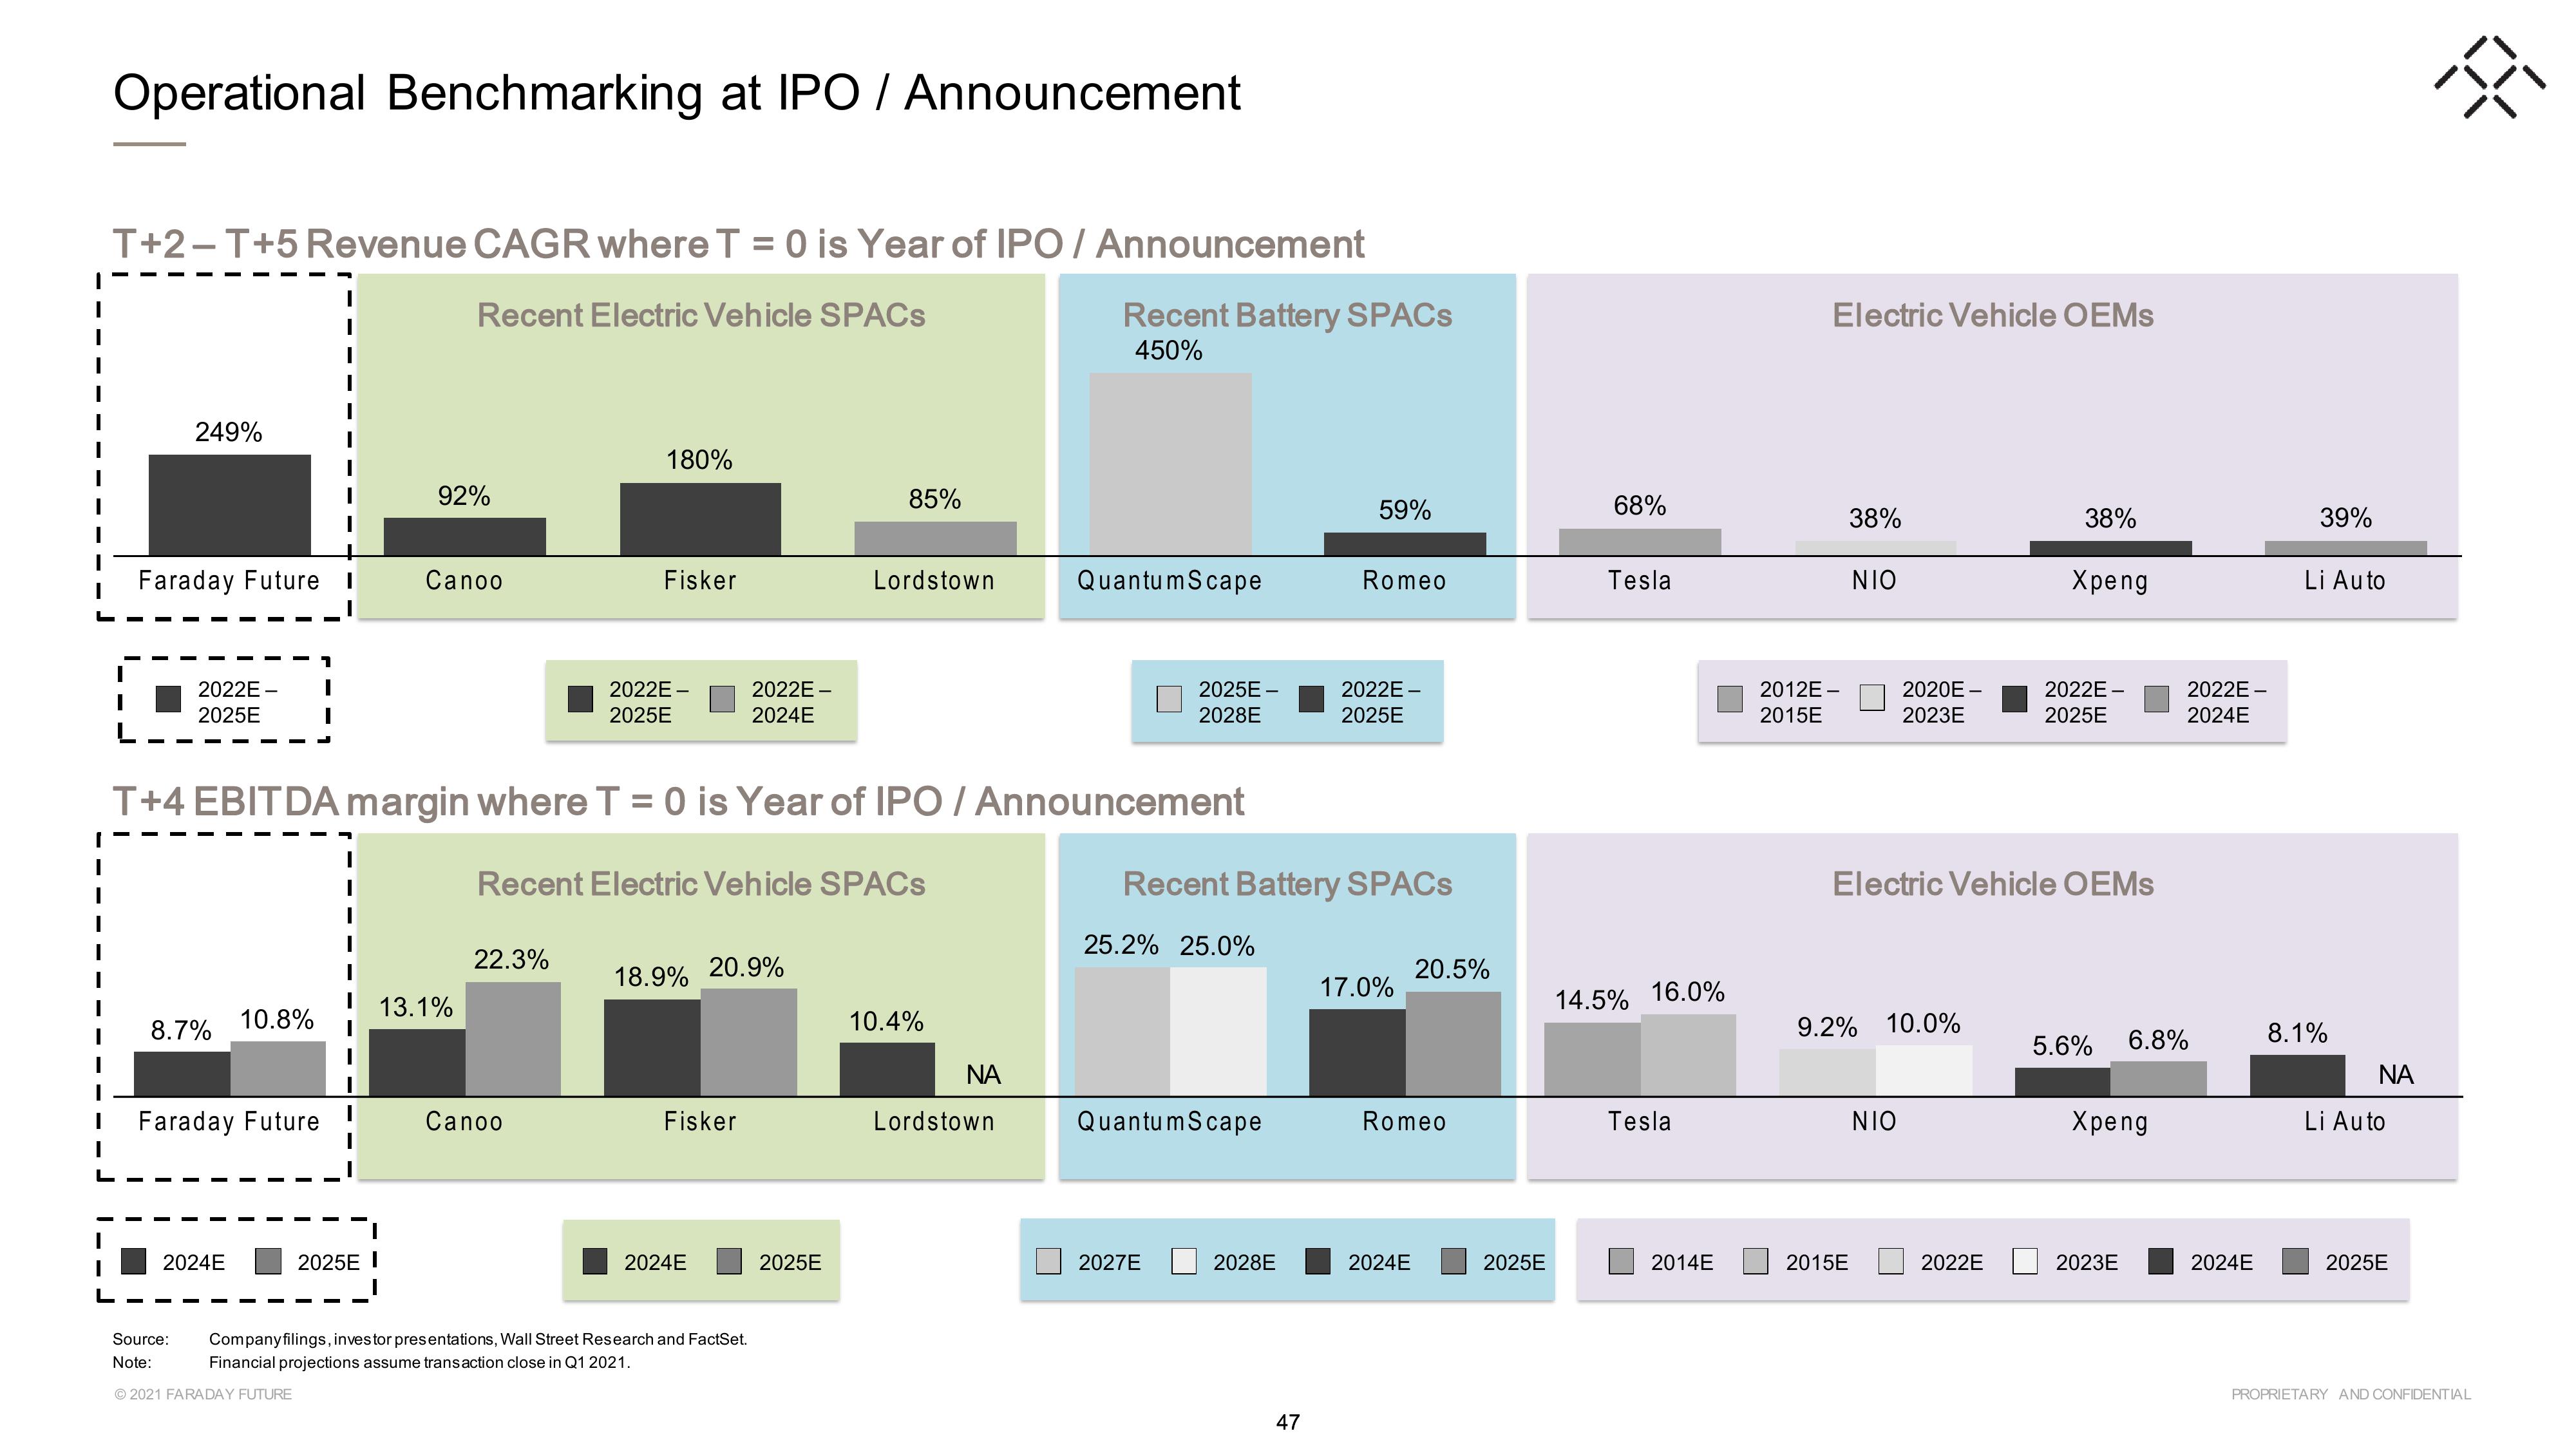
Operational Benchmarking at IPO / Announcement
T+2-T+5 Revenue CAGR where T = 0 is Year of IPO / Announcement
Recent Electric Vehicle SPACs
249%
2022E- I
2025E
1
Faraday Future I Canoo
8.7%
I
10.8%
Faraday Future
2024E
I
I
I
I
92%
I
I 13.1%
I
I
I
2025E I
T+4 EBITDA margin where T = 0 is Year of IPO / Announcement
180%
22.3%
Fisker
Canoo
2022E-
2025E
Recent Electric Vehicle SPACs
18.9%
2022E-
2024E
Fisker
2024E
20.9%
Source: Company filings, investor presentations, Wall Street Research and FactSet.
Note: Financial projections assume transaction close in Q1 2021.
Ⓒ2021 FARADAY FUTURE
85%
Lordstown
2025E
10.4%
ΝΑ
Recent Battery SPACs
450%
Lordstown
QuantumScape
2025E
2028E
25.2% 25.0%
Quantum Scape
2027E
Recent Battery SPACs
2028E
59%
47
Romeo
2022E-
2025E
17.0%
20.5%
Romeo
2024E
2025E
68%
Tesla
14.5% 16.0%
Tesla
2014E
Electric Vehicle OEMs
2012E-
2015E
38%
NIO
2015E
2020E-
2023E
9.2% 10.0%
NIO
Electric Vehicle OEMs
38%
2022E
Xpeng
2022E-
2025E
5.6% 6.8%
Xpeng
2023E
2022E-
2024E
2024E
39%
Li Auto
8.1%
ΝΑ
Li Auto
2025E
38
PROPRIETARY AND CONFIDENTIALView entire presentation