BAT Results Presentation Deck
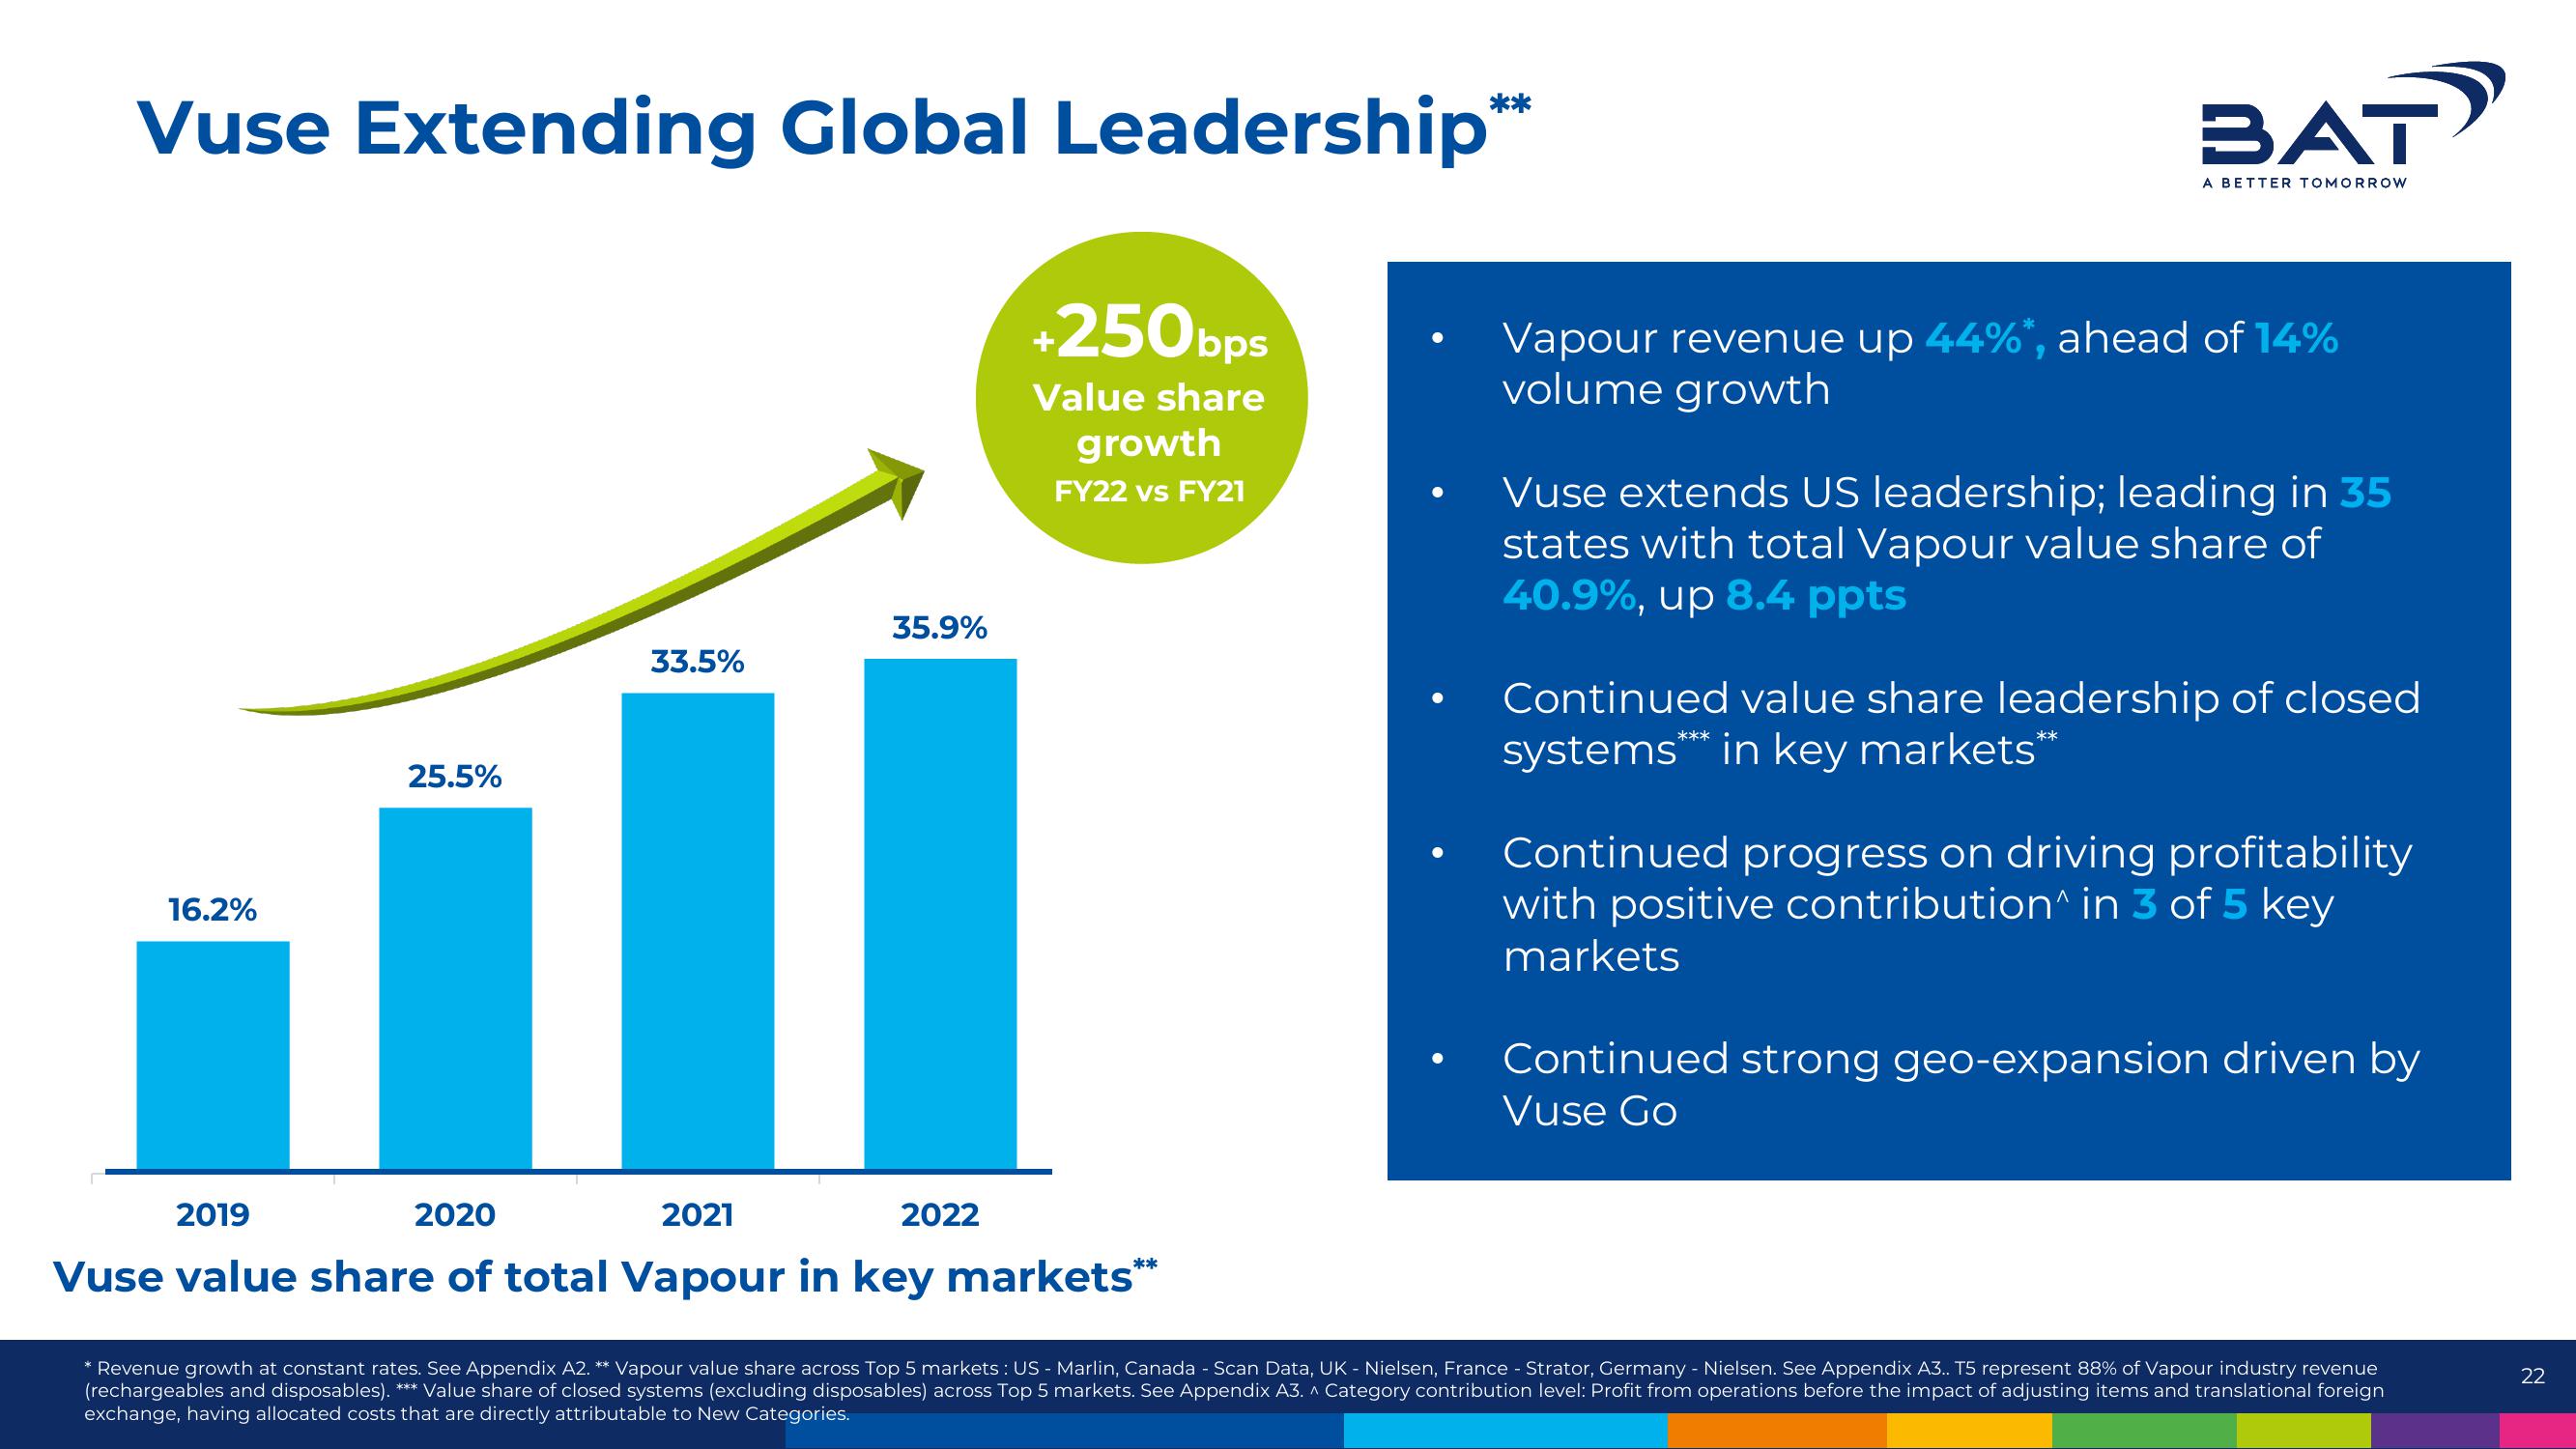
Vuse Extending Global Leadership**
16.2%
25.5%
33.5%
35.9%
+250bps
Value share
growth
FY22 vs FY21
2019
2020
2021
Vuse value share of total Vapour in key markets**
2022
BAT
A BETTER TOMORROW
Vapour revenue up 44%*, ahead of 14%
volume growth
Vuse extends US leadership; leading in 35
states with total Vapour value share of
40.9%, up 8.4 ppts
Continued value share leadership of closed
systems*** in key markets**
Continued progress on driving profitability
with positive contribution^ in 3 of 5 key
markets
Continued strong geo-expansion driven by
Vuse Go
* Revenue growth at constant rates. See Appendix A2. ** Vapour value share across Top 5 markets: US - Marlin, Canada - Scan Data, UK - Nielsen, France - Strator, Germany - Nielsen. See Appendix A3.. T5 represent 88% of Vapour industry revenue
(rechargeables and disposables). *** Value share of closed systems (excluding disposables) across Top 5 markets. See Appendix A3. ^ Category contribution level: Profit from operations before the impact of adjusting items and translational foreign
exchange, having allocated costs that are directly attributable to New Categories.
22View entire presentation