E2open Investor Presentation Deck
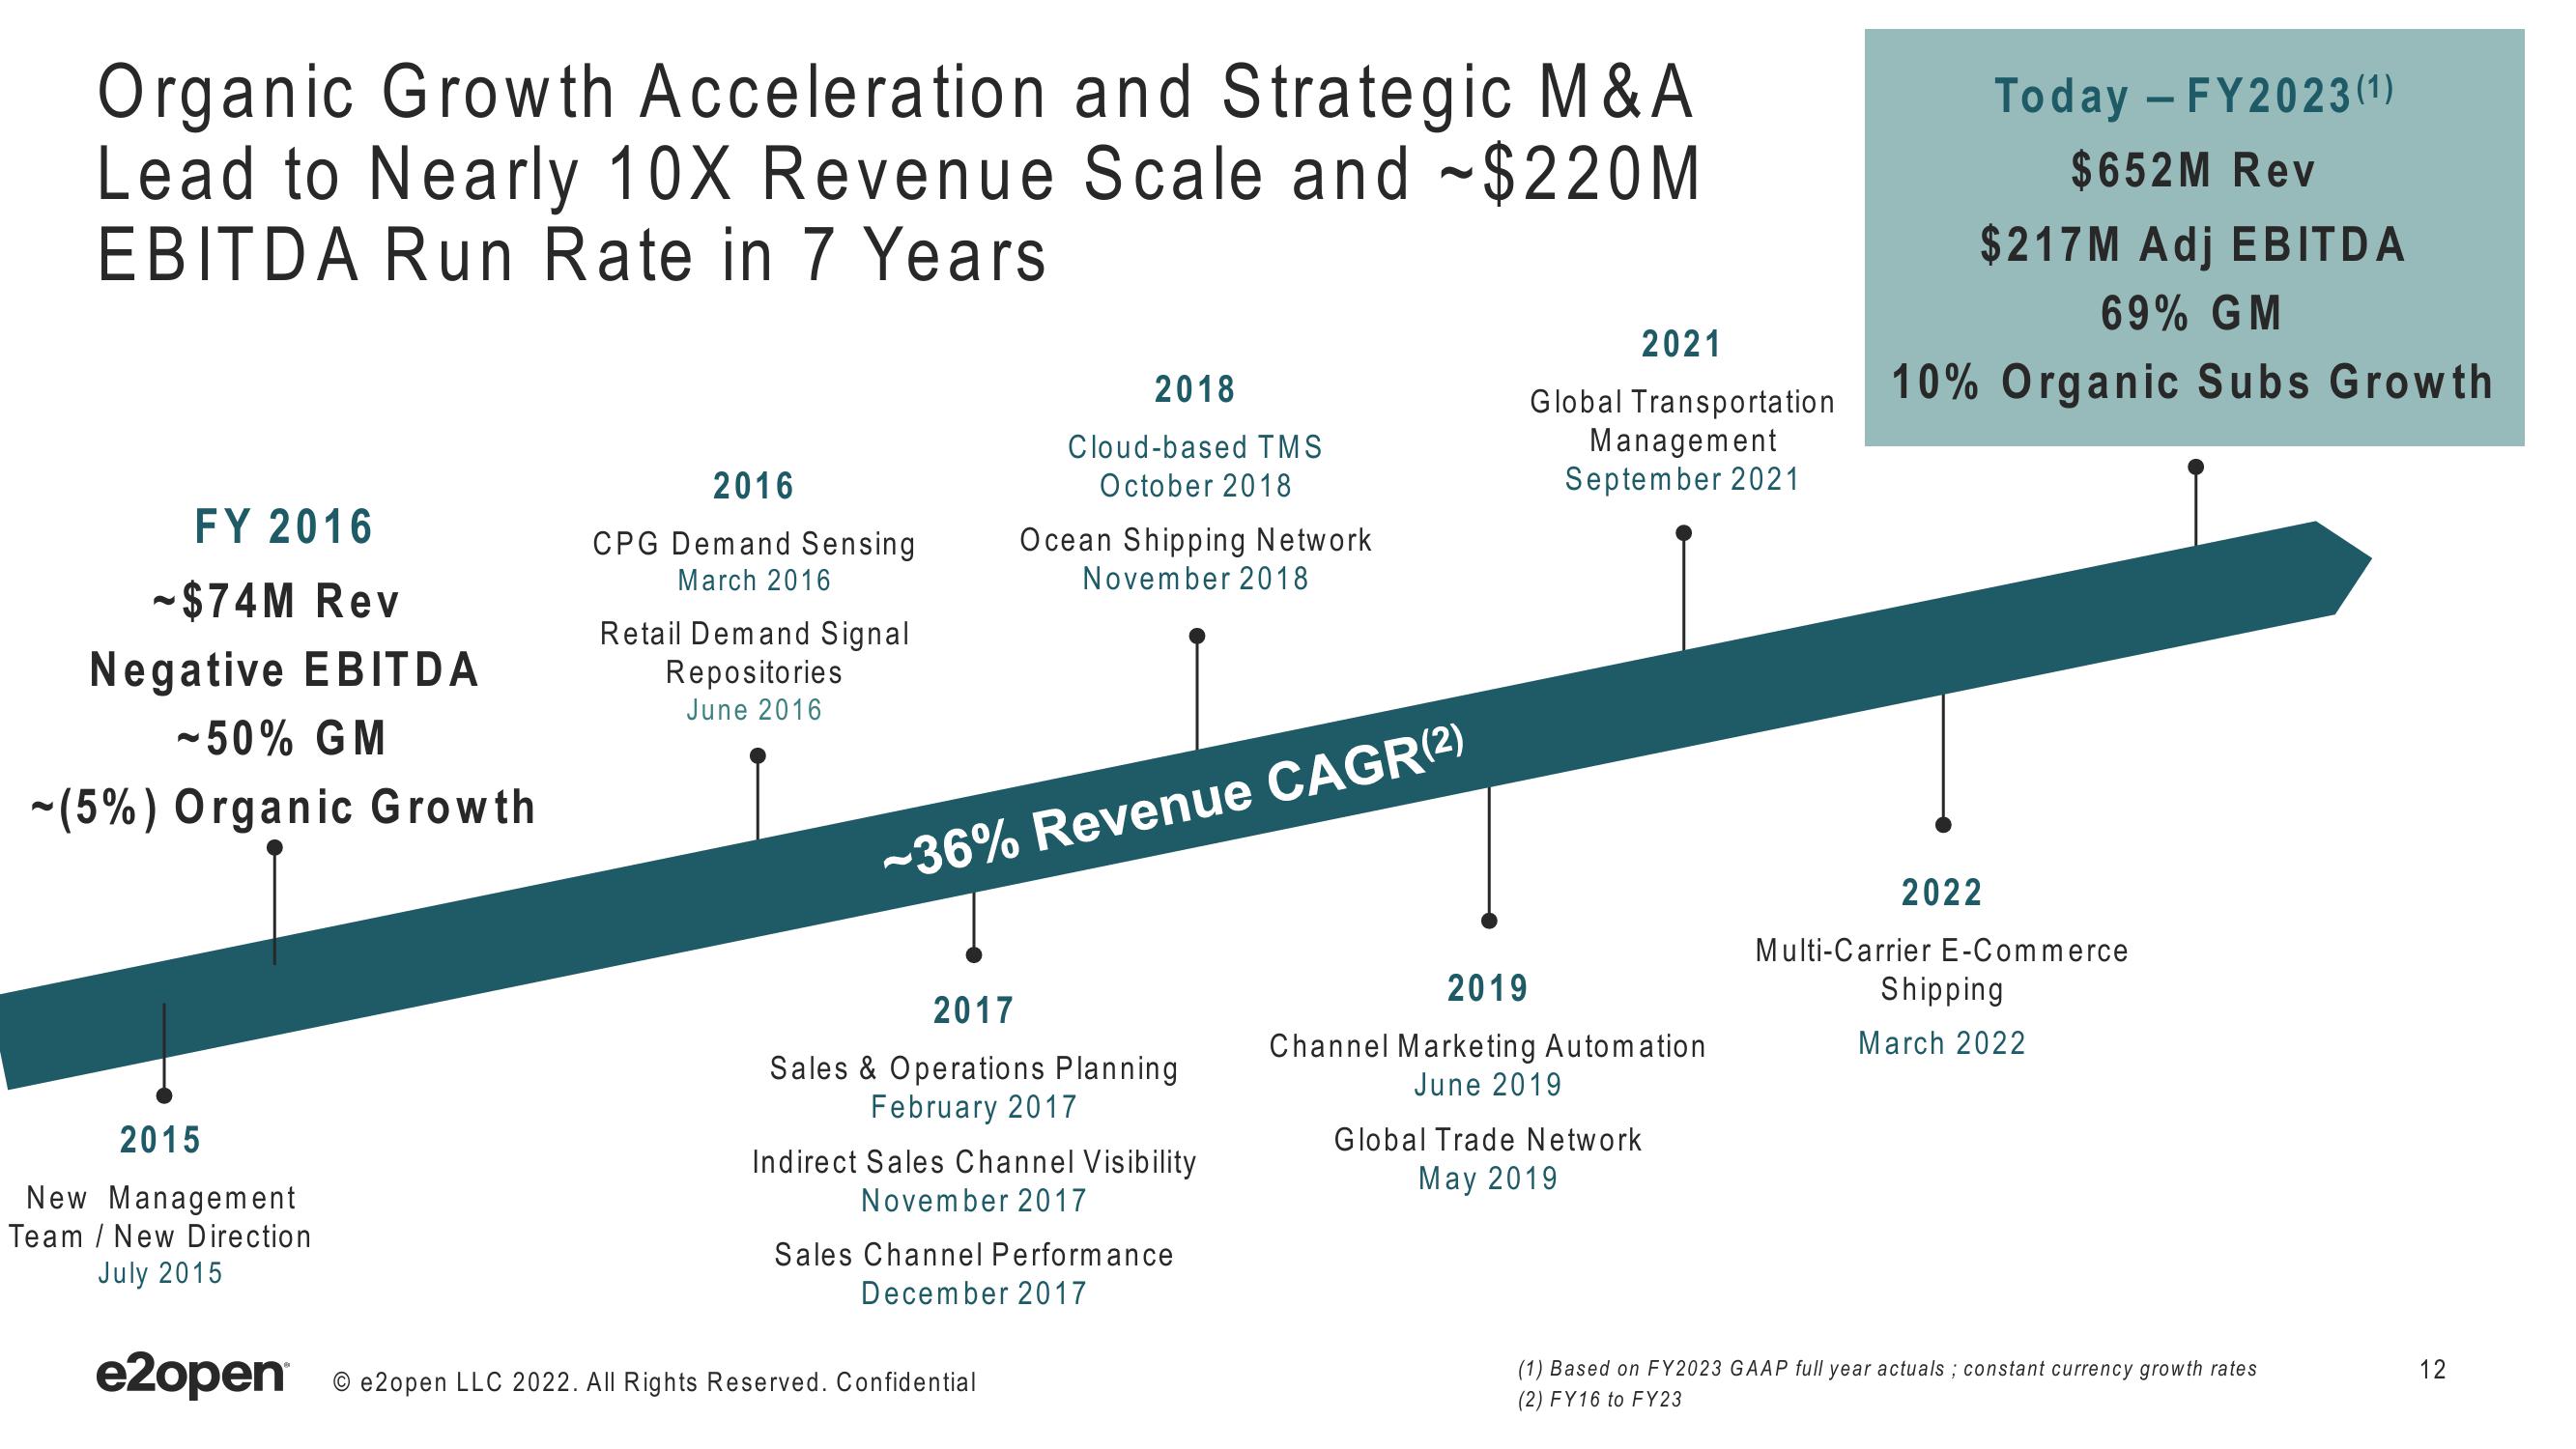
Organic Growth Acceleration and Strategic M&A
Lead to Nearly 10X Revenue Scale and $220M
EBITDA Run Rate in 7 Years
FY 2016
- $74M Rev
Negative EBITDA
-50% GM
~(5%) Organic Growth
2015
New Management
Team New Direction
July 2015
2016
CPG Demand Sensing
March 2016
Retail Demand Signal
Repositories
June 2016
2018
Cloud-based TMS
October 2018
Ocean Shipping Network
November 2018
~36% Revenue CAGR(²)
2017
Sales & Operations Planning
February 2017
Indirect Sales Channel Visibility
November 2017
e2opene2open LLC 2022. All Rights Reserved. Confidential
Sales Channel Performance
December 2017
2021
Global Transportation
Management
September 2021
2019
Channel Marketing Automation
June 2019
Global Trade Network
May 2019
Today - FY2023 (¹)
$652M Rev
$217M Adj EBITDA
69% GM
10% Organic Subs Growth
2022
Multi-Carrier E-Commerce
Shipping
March 2022
(1) Based on FY2023 GAAP full year actuals; constant currency growth rates
(2) FY16 to FY23
12View entire presentation