J.P.Morgan 4Q23 Earnings Results
JPMORGAN CHASE & CO.
CONSUMER & COMMUNITY BANKING
FINANCIAL HIGHLIGHTS
(in millions, except ratio data)
INCOME STATEMENT
REVENUE
Lending- and deposit-related fees
Asset management fees
Mortgage fees and related income
Card income
All other income (a)
Noninterest revenue
Net interest income
TOTAL NET REVENUE
Provision for credit losses
NONINTEREST EXPENSE
Compensation expense
Noncompensation expense (b)
TOTAL NONINTEREST EXPENSE
Income before income tax expense
Income tax expense
NET INCOME
REVENUE BY LINE OF BUSINESS
Banking & Wealth Management
Home Lending
Card Services & Auto
MORTGAGE FEES AND RELATED INCOME DETAILS
Production revenue
Net mortgage servicing revenue (c)
Mortgage fees and related income
FINANCIAL RATIOS
ROE
Overhead ratio
$
4Q23
856
899 (d)
261
684
1,270
3,970
14,127
18,097
$
4,023
5,313
9,336
6,572
1,784
$ 4,788
2,189 (d)
(d)
82
179
261
(d)
33%
52
(d)
$ 10,877 (e) $
(e)
1,161
6,059
$
$
$
3Q23
836
891
417
626
1,212 (d)
3,982
14,380 (d)
18,362
1,446
3,975
5,130
9,105
7,811
1,916
5,895
11,345
1,252
5,765
162
255
417
41 %
50
(d)
(d)
(d)
$
$
(e) $
$
2Q23
841
816
274
483
1,129
3,543
13,690 (d)
17,233
3,628
4,685
8,313
7,058
1,752
5,306
QUARTERLY TRENDS
1,862 (d)
10,936
1,007
5,290
102
172
274
(d)
38 %
48
(d)
(d)
$
1Q23
823
676
223
739
1,162
3,623
12,833
16,456
$
1,402
3,545
4,520
8,065
6,989
1,746
$ 5,243
(e) $ 10,041
(e)
720
5,695
75
148
223
40 %
49
$
$
4Q22
$
834
662
90
694
1,189
3,469
12,324
15,793
1,845
3,339
4,573 (f)
7,912
6,036
1,480
4,556
$ 9,582
584
5,627
43
47
90
(f)
(f)
35 %
50
(f)
(f)
4Q23 Change
3Q23
2%
1
(37)
9
5
(2)
(1)
51
1
4
3
(16)
(7)
(19)
(4)
(7)
5
(49)
(30)
(37)
JPMORGAN CHASE & Co.
4Q22
3%
36
190
(1)
7
14
15
15
19
20
16
18
9
21
5
14
99
8
91
281
190
$
$
$
$
2023
3,356
3,282 (d)
1,175
2,532
4,773 (d)
15,118
55,030 (d)
70,148
6,899 (d)
15,171
19,648
34,819 (d)
28,430
7,198
21,232
421
754
1,175
38
50
FULL YEAR
43,199 (e) $
4,140 (e)
22,809
%
$
$
$
2022
3,316
2,734
1,236
2,469 (f)
5,131 (f)
14,886
39,928
54,814
3,813
13,092
18,116 (f)
31,208
19,793
4,877 (f)
14,916
30,059 (f)
3,674
21,081
497
739
1,236
29 %
57
2023 Change
2022
1%
20
(5)
3
(7)
2
38
28
81
16
8
12
44
48
42
44
13
8
(15)
2
(5)
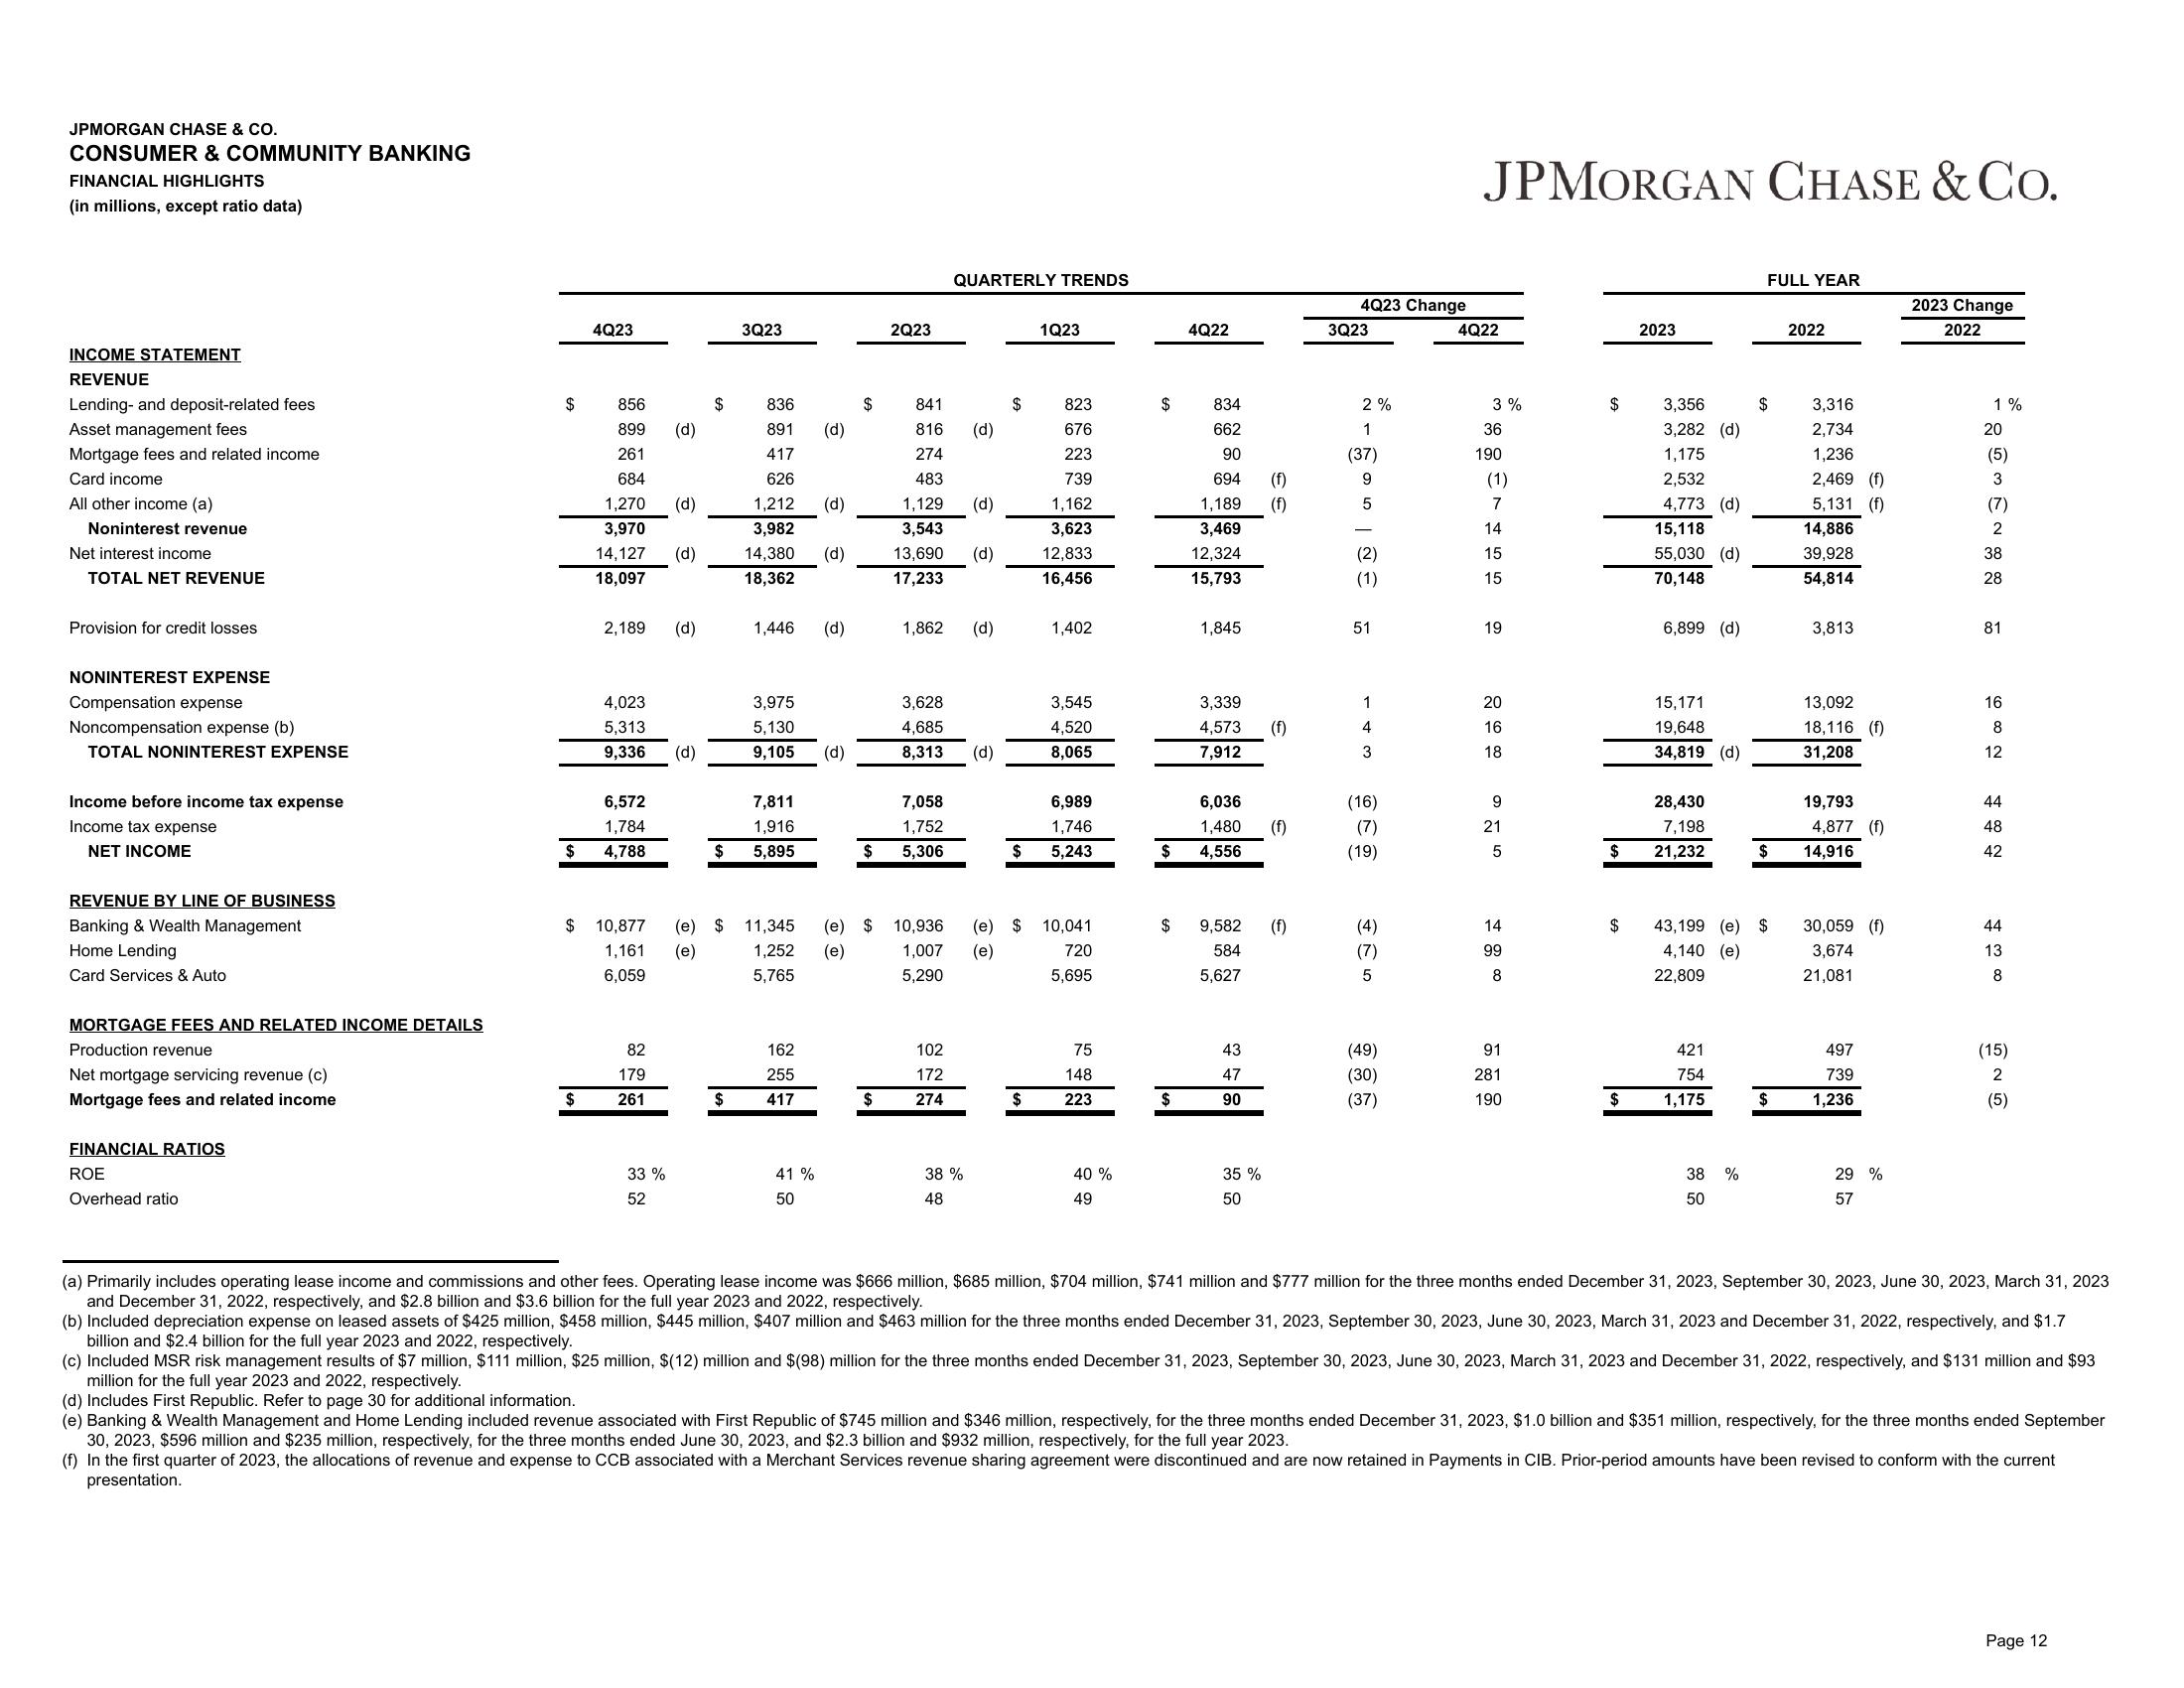
(a) Primarily includes operating lease income and commissions and other fees. Operating lease income was $666 million, $685 million, $704 million, $741 million and $777 million for the three months ended December 31, 2023, September 30, 2023, June 30, 2023, March 31, 2023
and December 31, 2022, respectively, and $2.8 billion and $3.6 billion for the full year 2023 and 2022, respectively.
(b) Included depreciation expense on leased assets of $425 million, $458 million, $445 million, $407 million and $463 million for the three months ended December 31, 2023, September 30, 2023, June 30, 2023, March 31, 2023 and December 31, 2022, respectively, and $1.7
billion and $2.4 billion for the full year 2023 and 2022, respectively.
(c) Included MSR risk management results of $7 million, $111 million, $25 million, $(12) million and $(98) million for the three months ended December 31, 2023, September 30, 2023, June 30, 2023, March 31, 2023 and December 31, 2022, respectively, and $131 million and $93
million for the full year 2023 and 2022, respectively.
(d) Includes First Republic. Refer to page 30 for additional information.
(e) Banking & Wealth Management and Home Lending included revenue associated with First Republic of $745 million and $346 million, respectively, for the three months ended December 31, 2023, $1.0 billion and $351 million, respectively, for the three months ended September
30, 2023, $596 million and $235 million, respectively, for the three months ended June 30, 2023, and $2.3 billion and $932 million, respectively, for the full year 2023.
(f) In the first quarter of 2023, the allocations of revenue and expense to CCB associated with a Merchant Services revenue sharing agreement were discontinued and are now retained in Payments in CIB. Prior-period amounts have been revised to conform with the current
presentation.
Page 12View entire presentation