Xometry Results Presentation Deck
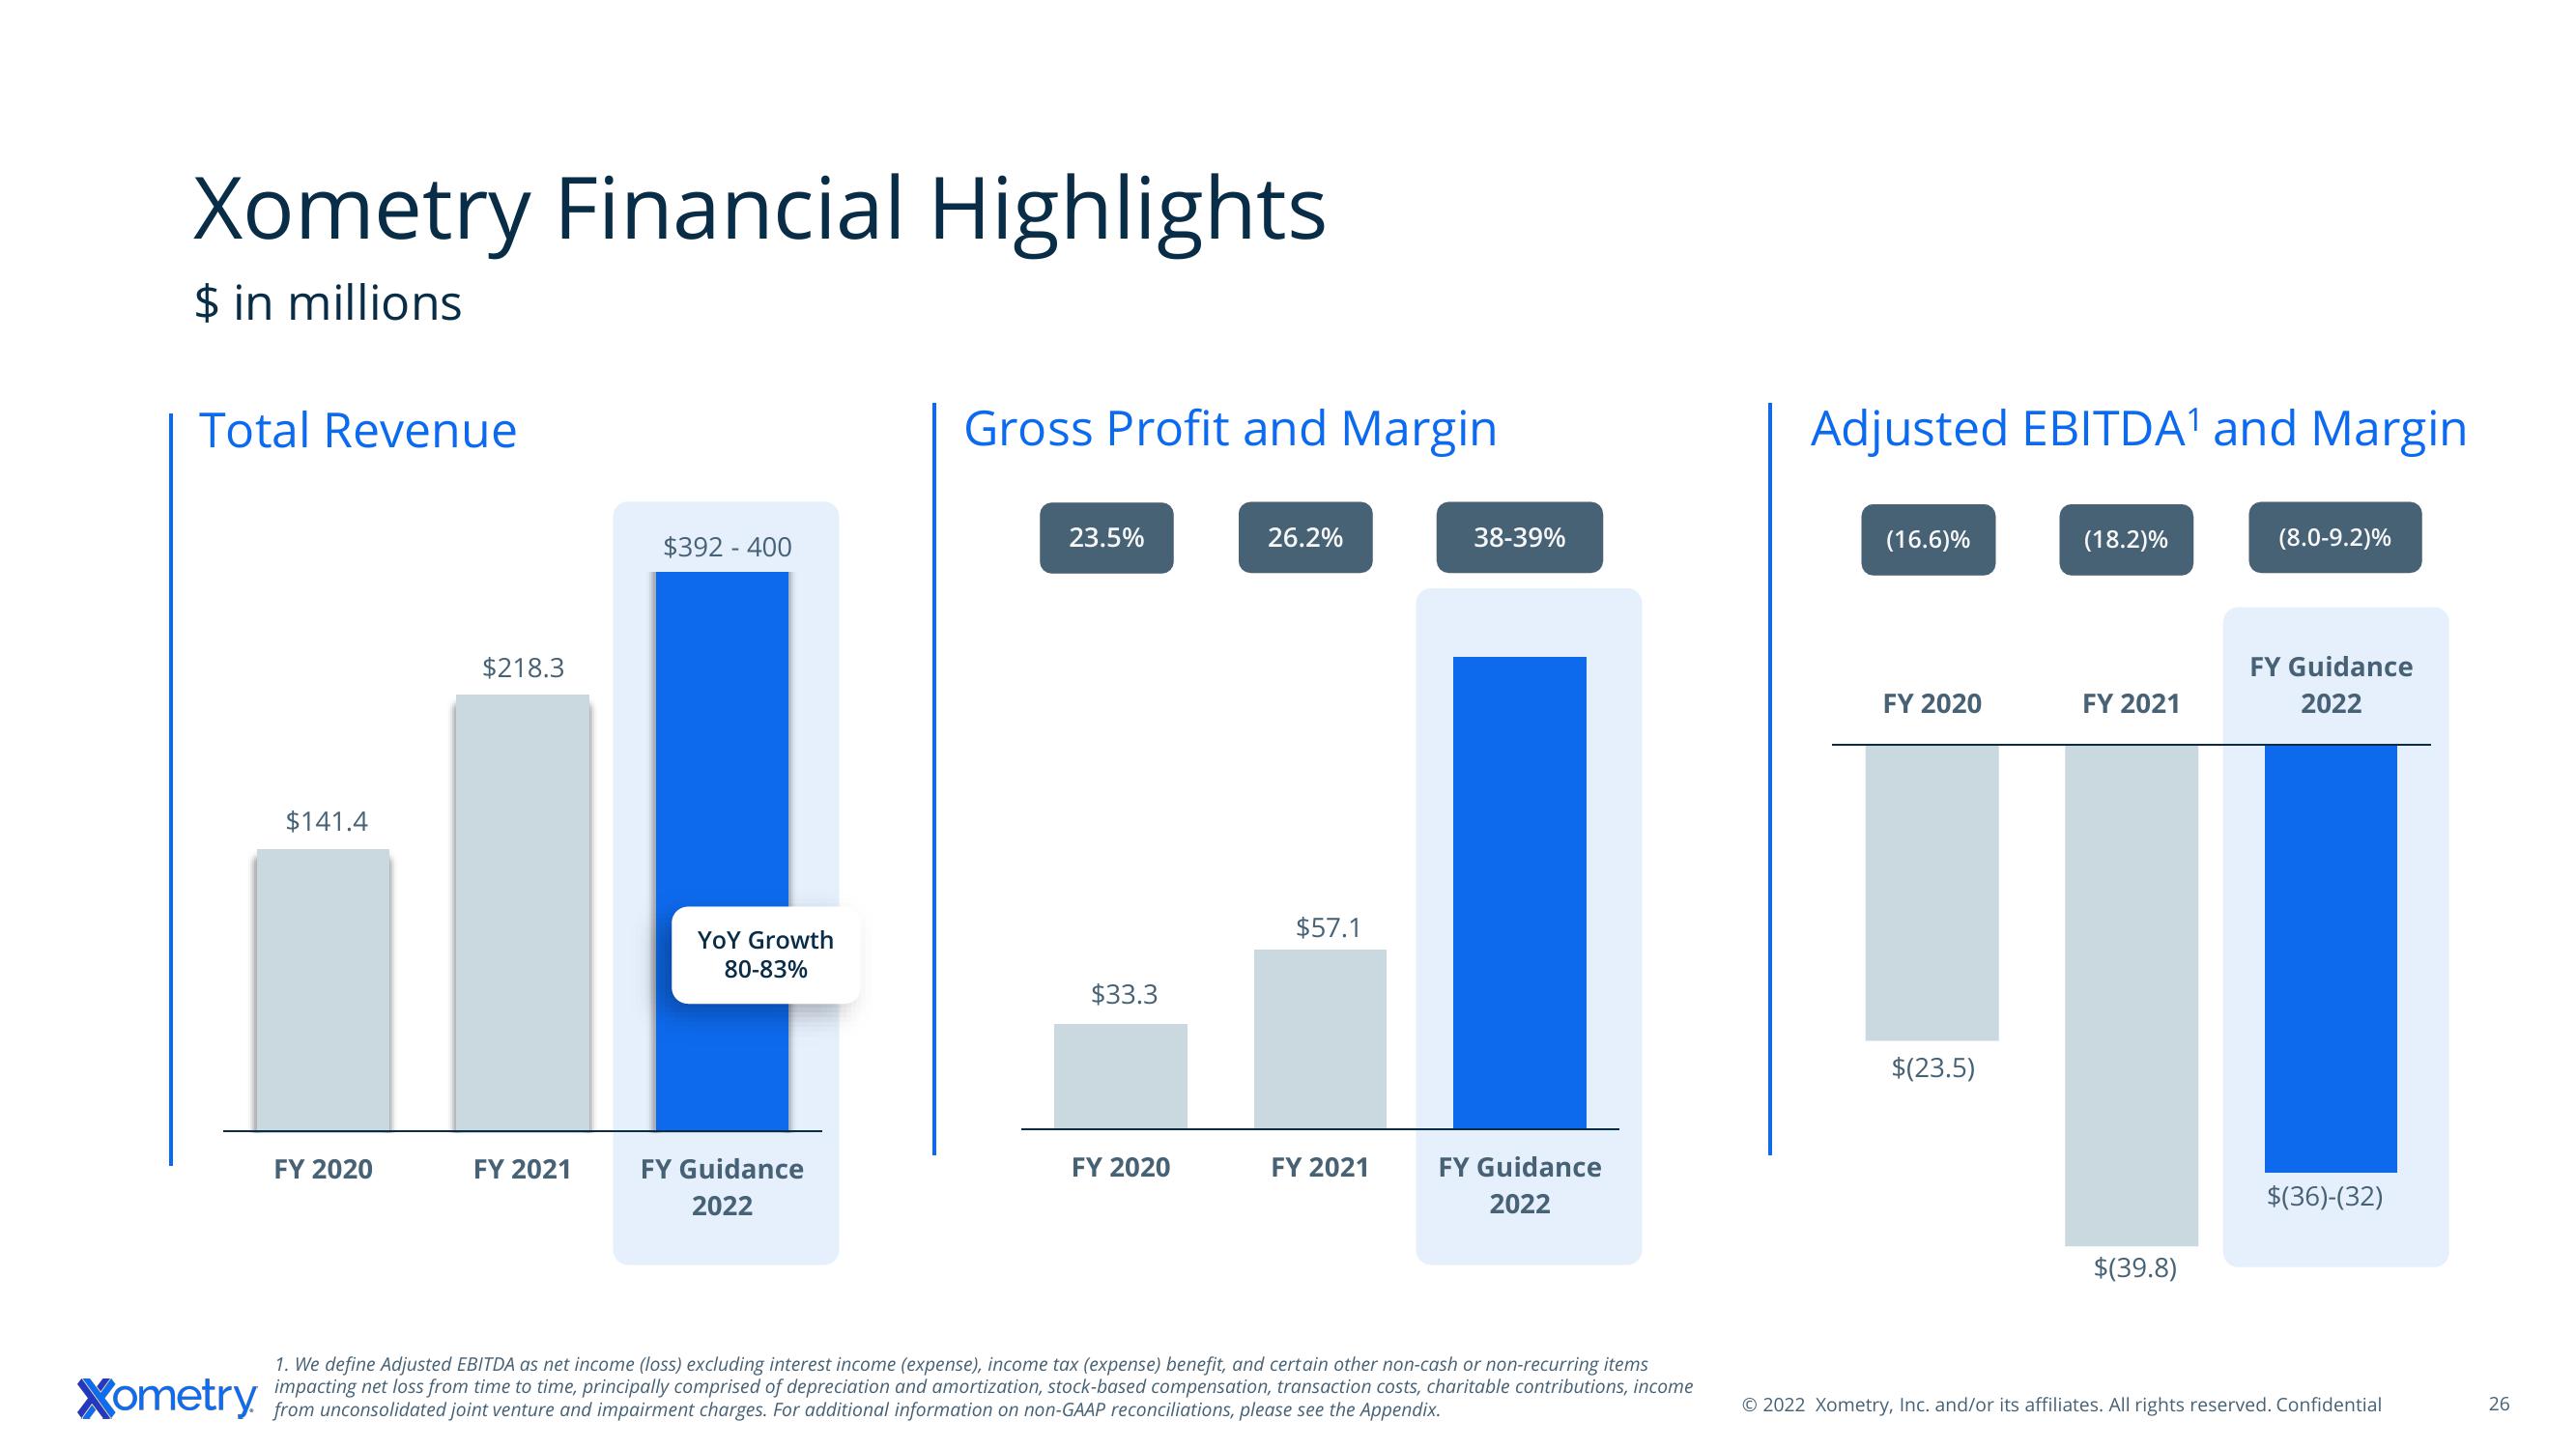
Xometry Financial Highlights
$ in millions
Total Revenue
Xometry
$141.4
FY 2020
$218.3
FY 2021
$392 - 400
YOY Growth
80-83%
FY Guidance
2022
Gross Profit and Margin
23.5%
$33.3
FY 2020
26.2%
$57.1
FY 2021
38-39%
FY Guidance
2022
1. We define Adjusted EBITDA as net income (loss) excluding interest income (expense), income tax (expense) benefit, and certain other non-cash or non-recurring items
impacting net loss from time to time, principally comprised of depreciation and amortization, stock-based compensation, transaction costs, charitable contributions, income
from unconsolidated joint venture and impairment charges. For additional information on non-GAAP reconciliations, please see the Appendix.
Adjusted EBITDA¹ and Margin
(16.6)%
FY 2020
$(23.5)
(18.2)%
FY 2021
$(39.8)
(8.0-9.2)%
FY Guidance
2022
$(36)-(32)
Ⓒ2022 Xometry, Inc. and/or its affiliates. All rights reserved. Confidential
26View entire presentation