Nikola Results Presentation Deck
1.
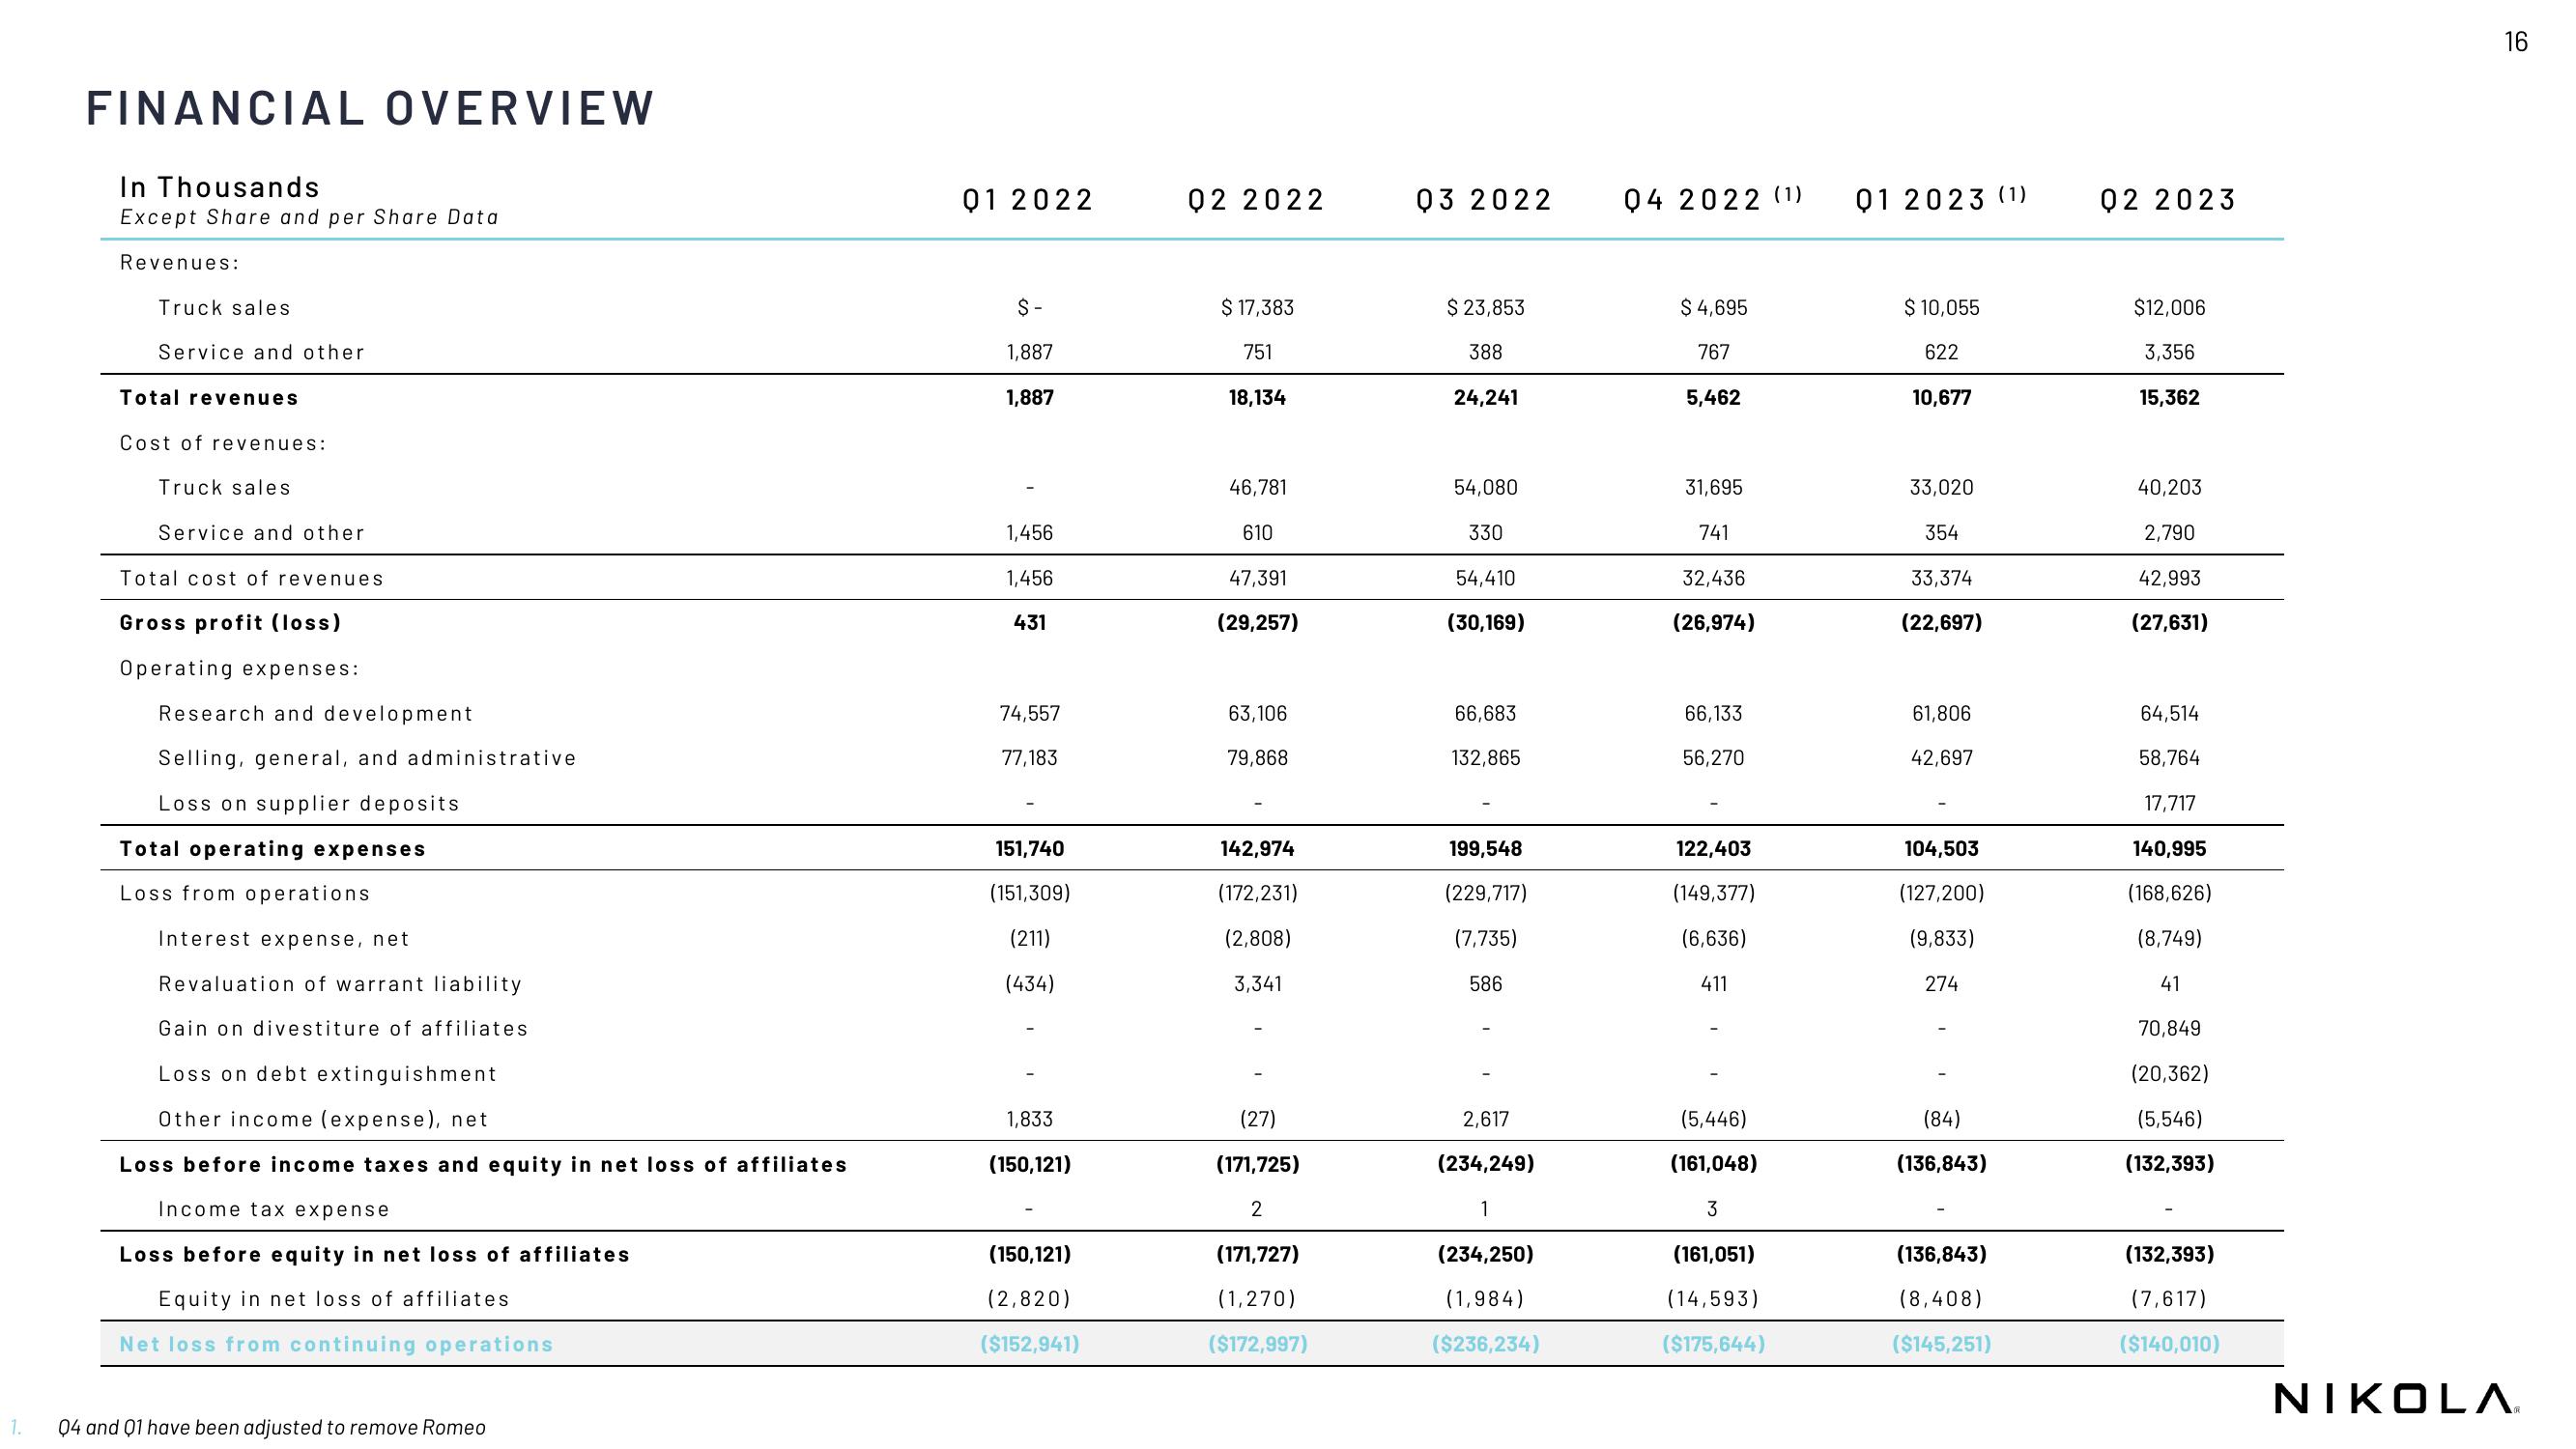
FINANCIAL OVERVIEW
In Thousands
Except Share and per Share Data
Revenues:
Truck sales
Service and other
Total revenues
Cost of revenues:
Truck sales
Service and other
Total cost of revenues
Gross profit (loss)
Operating expenses:
Research and development
Selling, general, and administrative
Loss on supplier deposits
Total operating expenses
Loss from operations
Interest expense, net
Revaluation of warrant liability
Gain on divestiture of affiliates
Loss on debt extinguishment
Other income (expense), net
Loss before income taxes and equity in net loss of affiliates
Income tax expense
Loss before equity in net loss of affiliates
Equity in net loss of affiliates
Net loss from continuing operations
04 and 01 have been adjusted to remove Romeo
01 2022
$-
1,887
1,887
1,456
1,456
431
74,557
77,183
151,740
(151,309)
(211)
(434)
1,833
(150,121)
(150,121)
(2,820)
($152,941)
02 2022
$ 17,383
751
18,134
46,781
610
47,391
(29,257)
63,106
79,868
142,974
(172,231)
(2,808)
3,341
(27)
(171,725)
2
(171,727)
(1,270)
($172,997)
03 2022
$ 23,853
388
24,241
54,080
330
54,410
(30,169)
66,683
132,865
199,548
(229,717)
(7,735)
586
2,617
(234,249)
1
(234,250)
(1,984)
($236,234)
04 2022 (1)
$ 4,695
767
5,462
31,695
741
32,436
(26,974)
66,133
56,270
122,403
(149,377)
(6,636)
411
(5,446)
(161,048)
3
(161,051)
(14,593)
($175,644)
01 2023 (1)
$10,055
622
10,677
33,020
354
33,374
(22,697)
61,806
42,697
104,503
(127,200)
(9,833)
274
(84)
(136,843)
(136,843)
(8,408)
($145,251)
02 2023
$12,006
3,356
15,362
40,203
2,790
42,993
(27,631)
64,514
58,764
17,717
140,995
(168,626)
(8,749)
41
70,849
(20,362)
(5,546)
(132,393)
(132,393)
(7,617)
($140,010)
16
NIKOLAView entire presentation