Salvatore Ferragamo Results Presentation Deck slide image

Salvatore Ferragamo Results Presentation Deck

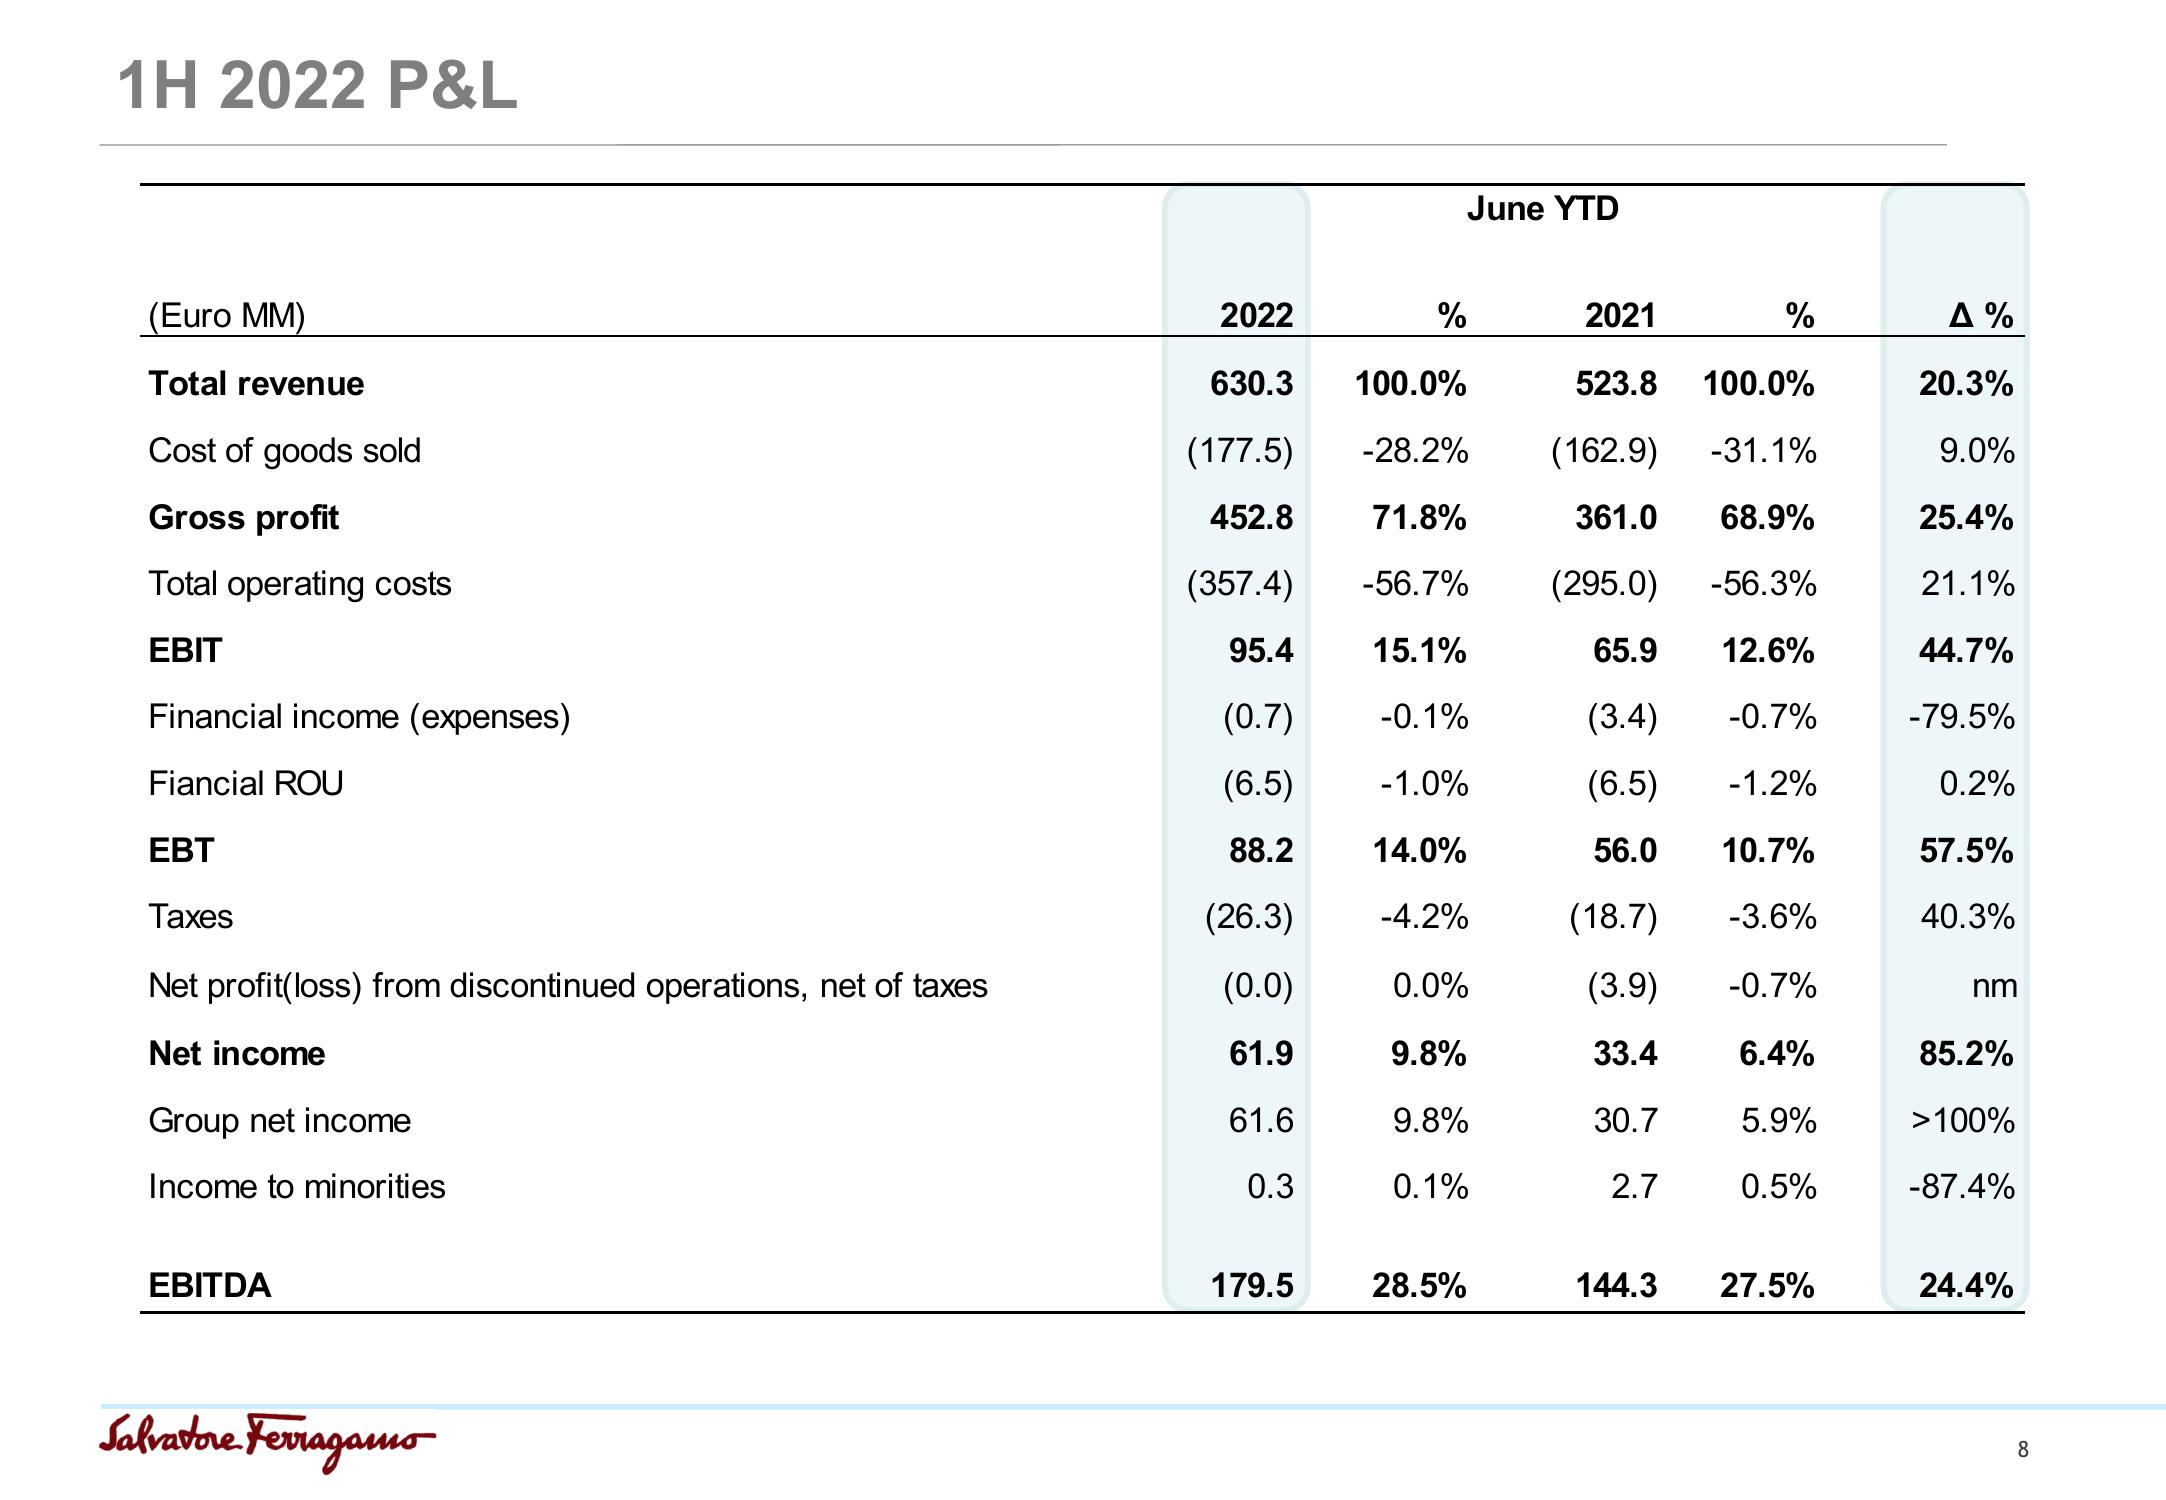
1H 2022 P&L (Euro MM) Total revenue Cost of goods sold Gross profit Total operating costs EBIT Financial income (expenses) Fiancial ROU EBT Taxes Net profit(loss) from discontinued operations, net of taxes Net income Group net income Income to minorities EBITDA Salvatore Ferragamo 2022 630.3 100.0% (177.5) 452.8 (357.4) 95.4 (0.7) (6.5) 88.2 (26.3) (0.0) 61.9 61.6 0.3 179.5 2021 523.8 100.0% -28.2% (162.9) -31.1% 71.8% 361.0 68.9% -56.7% (295.0) -56.3% 15.1% 65.9 12.6% -0.1% (3.4) -0.7% -1.0% (6.5) -1.2% 14.0% 56.0 10.7% (18.7) -3.6% (3.9) -0.7% 33.4 6.4% 30.7 5.9% 2.7 0.5% % June YTD -4.2% 0.0% 9.8% 9.8% 0.1% 28.5% % 144.3 27.5% Δ % 20.3% 9.0% 25.4% 21.1% 44.7% -79.5% 0.2% 57.5% 40.3% nm 85.2% >100% -87.4% 24.4% 8
View entire presentation