Maersk Investor Presentation Deck
Financial highlights Q3 2020
Strong improvements in profitability driven by all segments
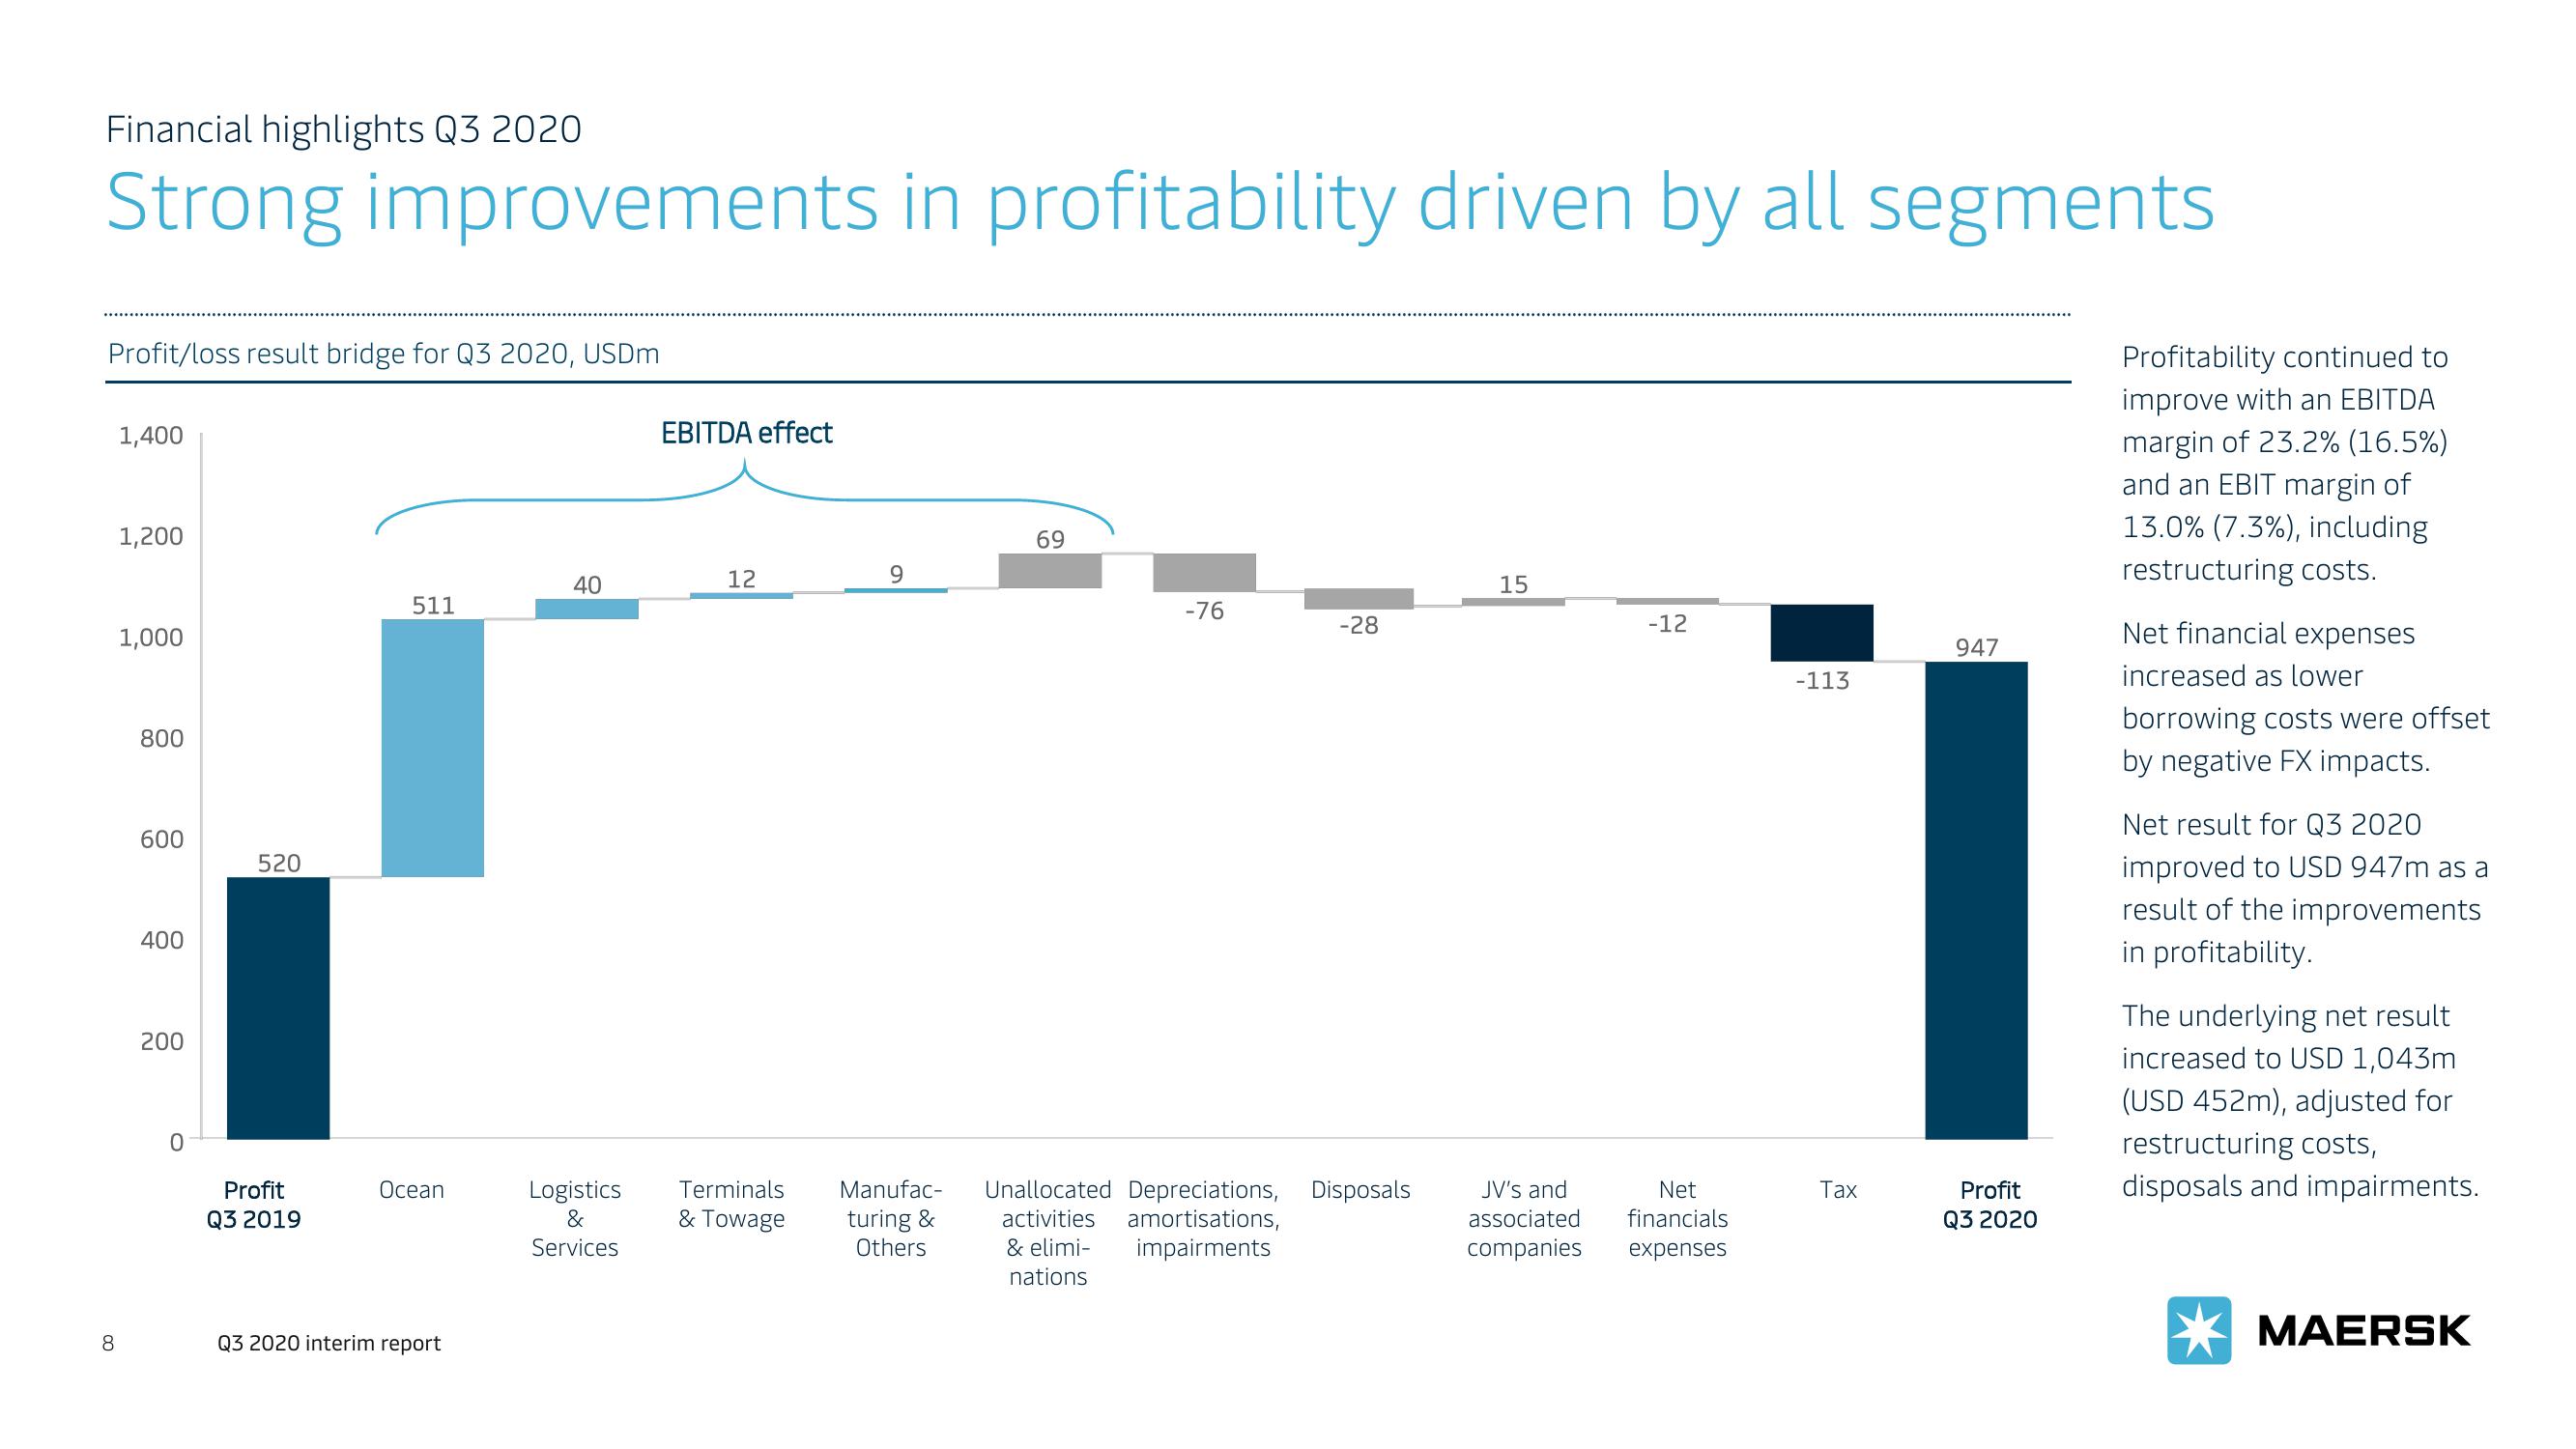
Profit/loss result bridge for Q3 2020, USDm
8
1,400
1,200
1,000
800
600
400
200
0
520
Profit
Q3 2019
511
Ocean
Q3 2020 interim report
40
Logistics
&
Services
EBITDA effect
12
Terminals
& Towage
9
Manufac-
turing &
Others
69
-76
-28
Unallocated Depreciations, Disposals
activities amortisations,
impairments
& elimi-
nations
15
-12
JV's and
Net
associated financials
companies expenses
-113
Tax
947
Profit
Q3 2020
Profitability continued to
improve with an EBITDA
margin of 23.2% (16.5%)
and an EBIT margin of
13.0% (7.3%), including
restructuring costs.
Net financial expenses
increased as lower
borrowing costs were offset
by negative FX impacts.
Net result for Q3 2020
improved to USD 947m as a
result of the improvements
in profitability.
The underlying net result
increased to USD 1,043m
(USD 452m), adjusted for
restructuring costs,
disposals and impairments.
MAERSKView entire presentation