J.P.Morgan 4Q23 Earnings Results
JPMORGAN CHASE & CO.
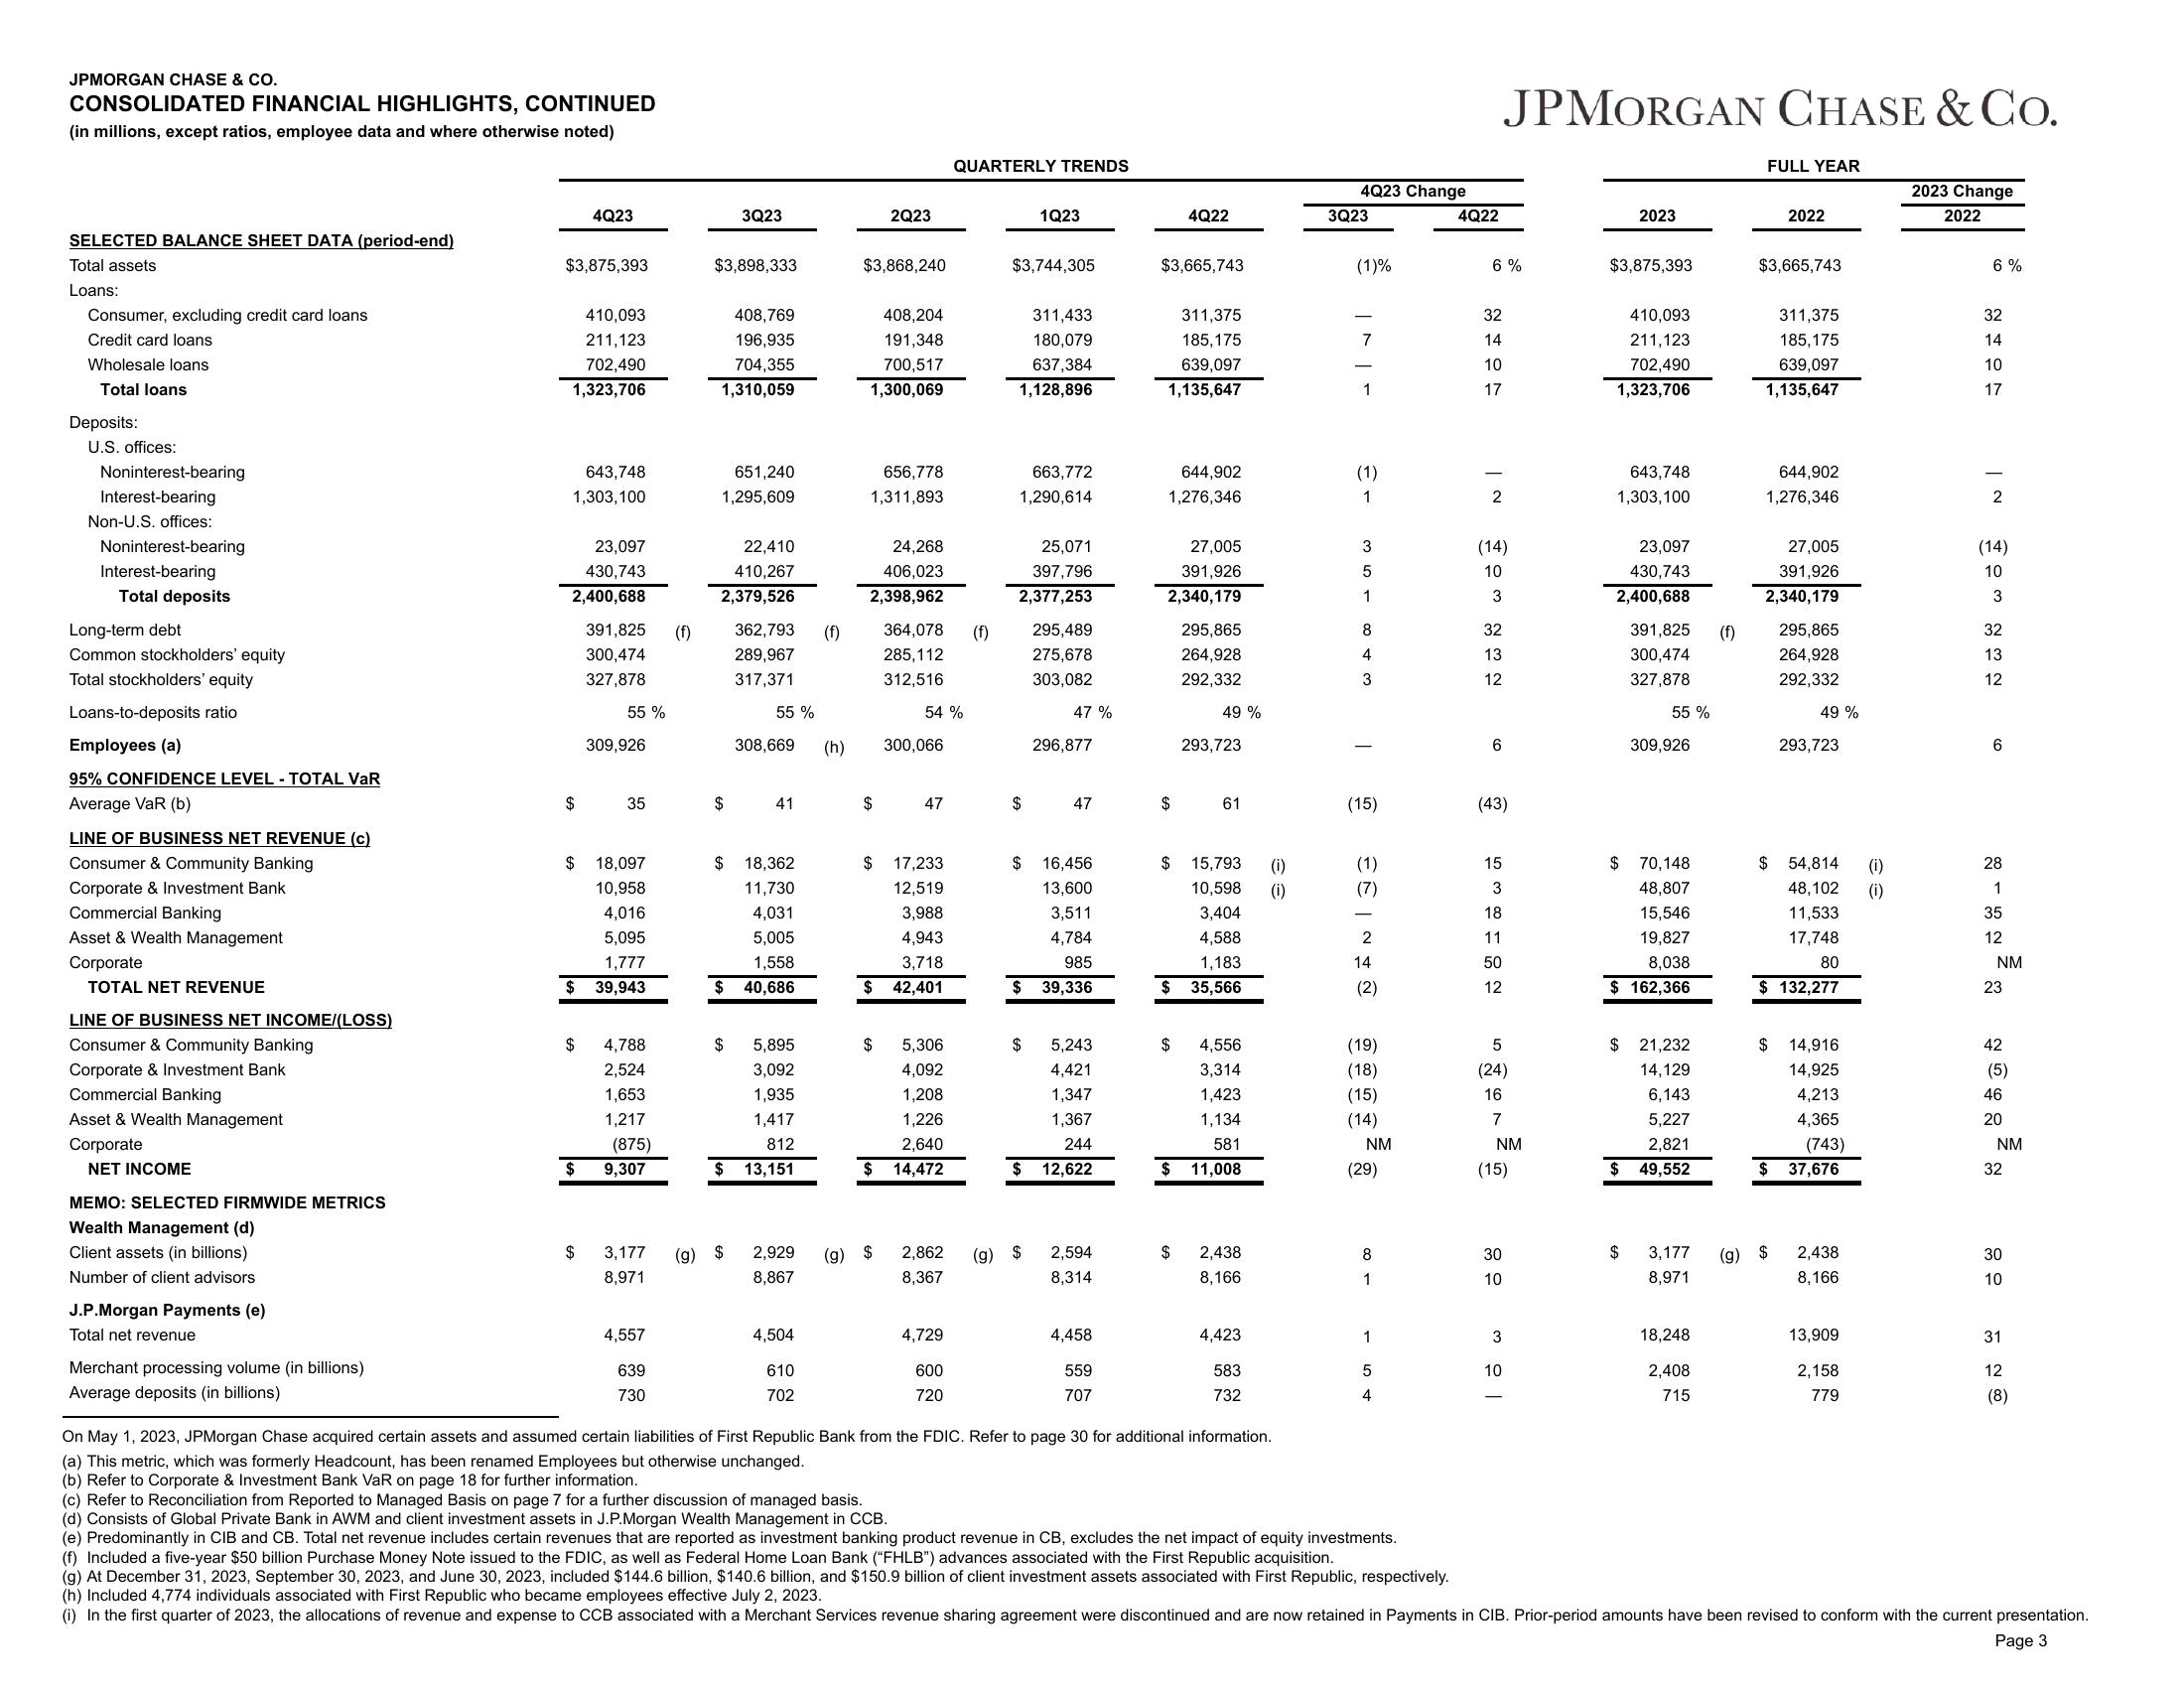
CONSOLIDATED FINANCIAL HIGHLIGHTS, CONTINUED
(in millions, except ratios, employee data and where otherwise noted)
SELECTED BALANCE SHEET DATA (period-end)
Total assets
Loans:
Consumer, excluding credit card loans
Credit card loans
Wholesale loans
Total loans
Deposits:
U.S. offices:
Noninterest-bearing
Interest-bearing
Non-U.S. offices:
Noninterest-bearing
Interest-bearing
Total deposits
Long-term debt
Common stockholders' equity
Total stockholders' equity
Loans-to-deposits ratio
Employees (a)
95% CONFIDENCE LEVEL - TOTAL VAR
Average VaR (b)
LINE OF BUSINESS NET REVENUE (c)
Consumer & Community Banking
Corporate & Investment Bank
Commercial Banking
Asset & Wealth Management
Corporate
TOTAL NET REVENUE
LINE OF BUSINESS NET INCOME/(LOSS)
Consumer & Community Banking
Corporate & Investment Bank
Commercial Banking
Asset & Wealth Management
Corporate
NET INCOME
MEMO: SELECTED FIRMWIDE METRICS
Wealth Management (d)
Client assets (in billions)
Numbe
ent advis
J.P.Morgan Payments (e)
Total net revenue
Merchant processing volume (in billions)
Average deposits (in billions)
$3,875,393
410,093
211,123
702,490
1,323,706
643,748
1,303,100
23,097
430,743
2,400,688
$
4Q23
$
$
$
$
391,825 (f)
300,474
327,878
55 %
309,926
35
18,097
10,958
4,016
5,095
1,777
39,943
4,788
2,524
1,653
1,217
(875)
9,307
3,177
8,971
4,557
639
730
$3,898,333
408,769
196,935
704,355
1,310,059
3Q23
651,240
1,295,609
22,410
410,267
2,379,526
$
$
362,793
289,967
317,371
55 %
(g) $
308,669
$ 18,362
11,730
4,031
41
5,005
1,558
$ 40,686
5,895
3,092
1,935
1,417
812
$13,151
2,929
8,867
4,504
610
702
(f)
(h)
(g)
$3,868,240
2Q23
408,204
191,348
700,517
1,300,069
656,778
1,311,893
24,268
406,023
2,398,962
$
$
364,078 (f)
285,112
312,516
54%
300,066
47
17,233
12,519
3,988
4,943
3,718
$ 42,401
5,306
4,092
1,208
1,226
2,640
$ 14,472
QUARTERLY TRENDS
2,862
8,367
4,729
600
720
$3,744,305
311,433
180,079
637,384
1,128,896
1Q23
663,772
1,290,614
25,071
397,796
2,377,253
295,489
275,678
303,082
$
$
47 %
(g) $
296,877
$ 16,456
13,600
3,511
4,784
985
$ 39,336
47
5,243
4,421
1,347
1,367
244
$12,622
2,594
8,31.
4,458
559
707
$3,665,743
311,375
185,175
639,097
1,135,647
644,902
1,276,346
4Q22
27,005
391,926
2,340,179
295,865
264,928
292,332
$
$
$
$
49 %
$ 15,793 (1)
10,598
3,404
(1)
4,588
1,183
$ 35,566
293,723
61
4,556
3,314
1,423
1,134
581
11,008
2,438
8,166
4,423
583
732
On May 1, 2023, JPMorgan Chase acquired certain assets and assumed certain liabilities of First Republic Bank from the FDIC. Refer to page 30 for additional information.
(a) This metric, which was formerly Headcount, has been renamed Employees but otherwise unchanged.
(b) Refer to Corporate & Investment Bank VaR on page 18 for further information.
4Q23 Change
3Q23
(1)%
7
1
(1)
1
35-00 +3
1
8
4
T
(15)
(1)
(7)
2
14
(2)
(19)
(18)
(15)
(14)
NM
(29)
8
1
1
5
4
(c) Refer to Reconciliation from Reported to Managed Basis on page 7 for a further discussion of managed basis.
(d) Consists of Global Private Bank in AWM and client investment assets in J.P.Morgan Wealth Management in CCB.
(e) Predominantly in CIB and CB. Total net revenue includes certain revenues that are reported as investment banking product revenue in CB, excludes the net impact of equity investments.
4Q22
6%
32
14
10
17
2
(14)
10
JPMORGAN CHASE & CO.
3
32
13
12
6
(43)
15
3
18
11
50
12
5
(24)
16
7
NM
(15)
30
10
3
10
2023
$3,875,393
410,093
211,123
702,490
1,323,706
643,748
1,303, 100
23,097
430,743
2,400,688
391,825 (f)
300,474
327,878
$
55 %
309,926
$ 70,148
48,807
15,546
19,827
8,038
$ 162,366
$ 21,232
14,129
6,143
5,227
2,821
49,552
3,177
8,971
18,248
2,408
715
FULL YEAR
2022
$3,665,743
311,375
185, 175
639,097
1,135,647
644,902
1,276,346
27,005
391,926
2,340,179
295,865
264,928
292,332
49%
293,723
$ 54,814
(1)
48,102 (i)
11,533
17,748
80
$ 132,277
$ 14,916
14,925
4,213
4,365
(743)
$ 37,676
(g) $ 2,438
8,166
13,909
2,158
779
2023 Change
2022
6%
32
14
10
17
2
(14)
10
3
32
13
12
6
28
1
35
12
NM
23
42
(5)
46
20
NM
32
30
10
31
12
(8)
(f) Included a five-year $50 billion Purchase Money Note issued to the FDIC, as well as Federal Home Loan Bank ("FHLB") advances associated with the First Republic acquisition.
(g) At December 31, 2023, September 30, 2023, and June 30, 2023, included $144.6 billion, $140.6 billion, and $150.9 billion of client investment assets associated with First Republic, respectively.
(h) Included 4,774 individuals associated with First Republic who became employees effective July 2, 2023.
(i) In the first quarter of 2023, the allocations of revenue and expense to CCB associated with a Merchant Services revenue sharing agreement were discontinued and are now retained in Payments in CIB. Prior-period amounts have been revised to conform with the current presentation.
Page 3View entire presentation