Evercore Investment Banking Pitch Book
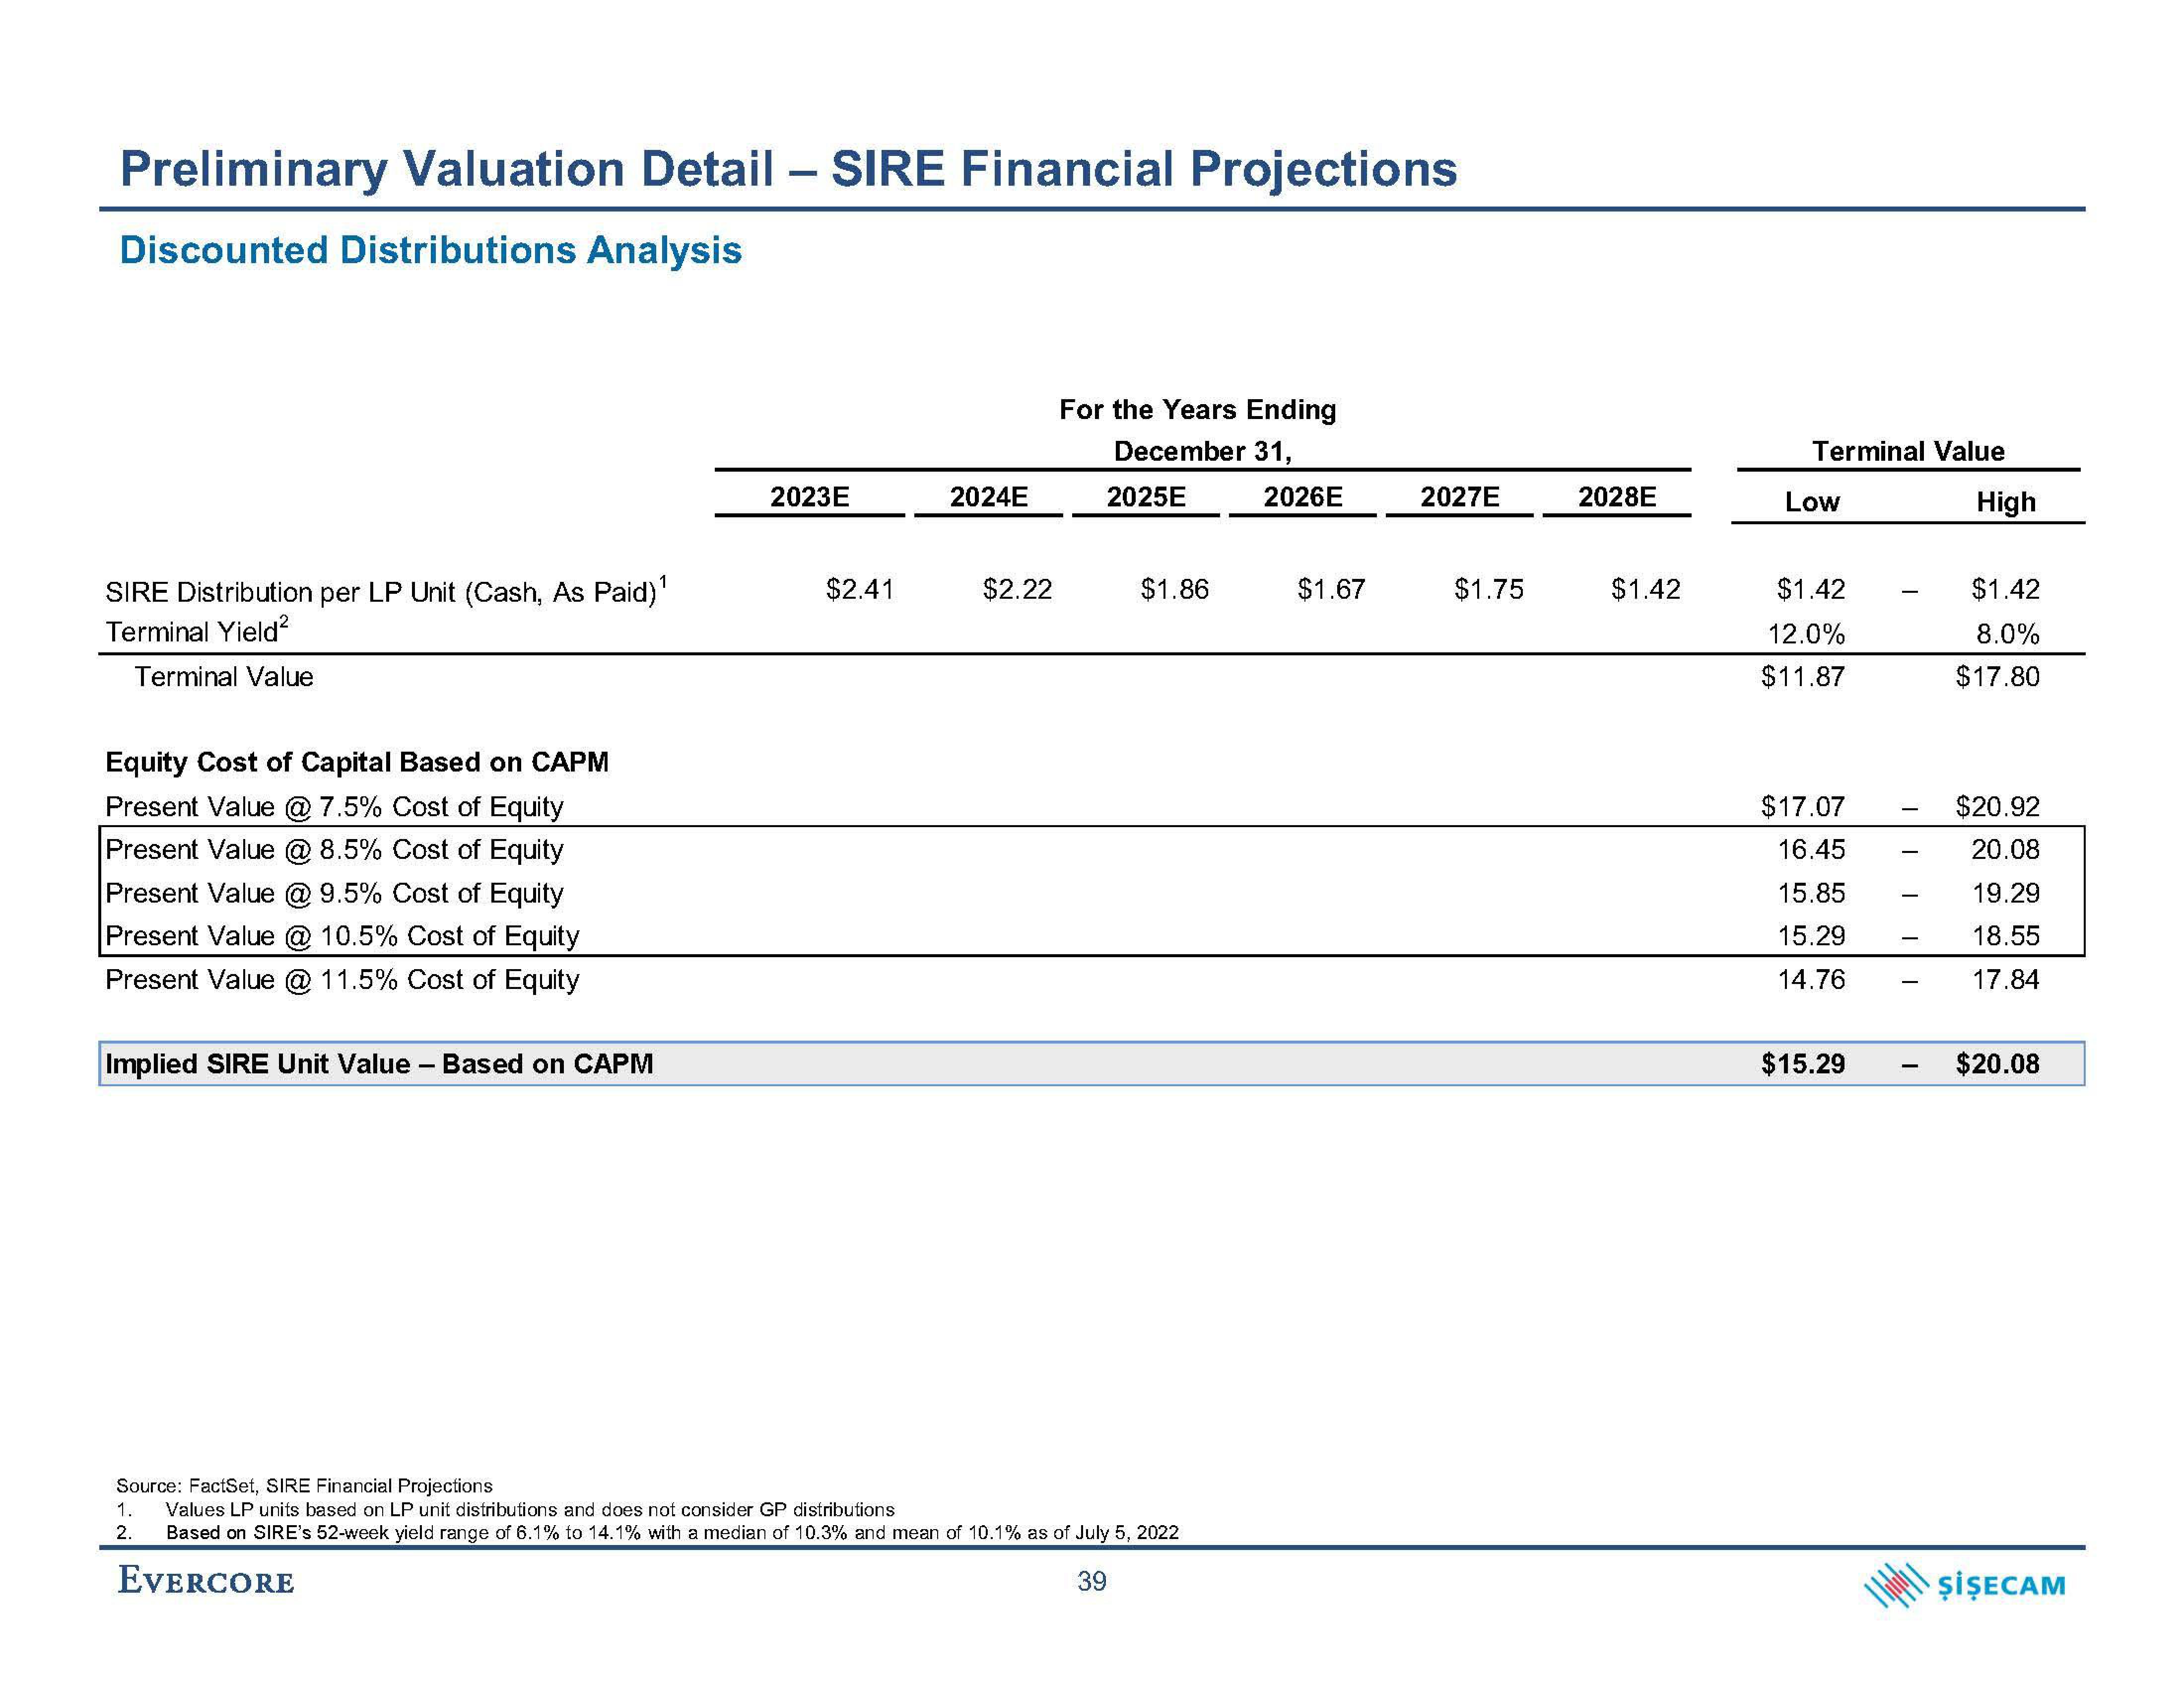
Preliminary Valuation Detail - SIRE Financial Projections
Discounted Distributions Analysis
SIRE Distribution per LP Unit (Cash, As Paid)¹
Terminal Yield²
Terminal Value
Equity Cost of Capital Based on CAPM
Present Value 7.5% Cost of Equity
Present Value @ 8.5% Cost of Equity
Present Value @ 9.5% Cost of Equity
Present Value @ 10.5% Cost of Equity
Present Value @ 11.5% Cost of Equity
Implied SIRE Unit Value - Based on CAPM
2023E
$2.41
2024E
$2.22
For the Years Ending
December 31,
2025E
$1.86
Source: FactSet, SIRE Financial Projections
1. Values LP units based on LP unit distributions and does not consider GP distributions
2.
Based on SIRE's 52-week yield range of 6.1% to 14.1% with a median of 10.3% and mean of 10.1% as of July 5, 2022
EVERCORE
39
2026E
$1.67
2027E
$1.75
2028E
$1.42
Terminal Value
Low
$1.42
12.0%
$11.87
$17.07
16.45
15.85
15.29
14.76
$15.29
-
I
-
High
$1.42
8.0%
$17.80
$20.92
20.08
19.29
18.55
17.84
$20.08
ŞİŞECAMView entire presentation