Credit Suisse Results Presentation Deck
Wealth Management
Lower PTI with higher NII offset by lower fees and transaction revenues, and an IT-related impairment
Revenues
PCL/
Costs
Profitability
AuM
Balance
Sheet
in CHF mn
12
Net interest income
Recurring commissions and fees
Transaction-based
Adjusted net revenues
Provision for credit losses
Adjusted total operating expenses
pre-tax income
Adjusted
Reported pre-tax income
Adjusted RoRCt
Reported RoRC+
Adjusted cost/income ratio
Adjusted net margin in bps
Assets under management in CHF bn
Net new assets in CHF bn
Net loans in CHF bn
Risk-weighted assets in CHF bn
Leverage exposure in CHF bn
3Q22
615
382
357
1,355
7
1,270
78
21
3%
1%
94%
635
(6.4)
89
63
231
2Q22
558
408
478
1,444
(11)
1,341
114
(96)
4%
(3)%
93%
7
662
(1.4)
93
62
235
3Q21
511
464
593
1,567
18
1,165
384
402
12%
13%
74%
20
761
5.4
107
65
245
A 3Q21
20%
(18)%
(40)%
(14)%
9%
(80)%
(95)%
(15)
(16)%
(17)%
(2)%
(6)%
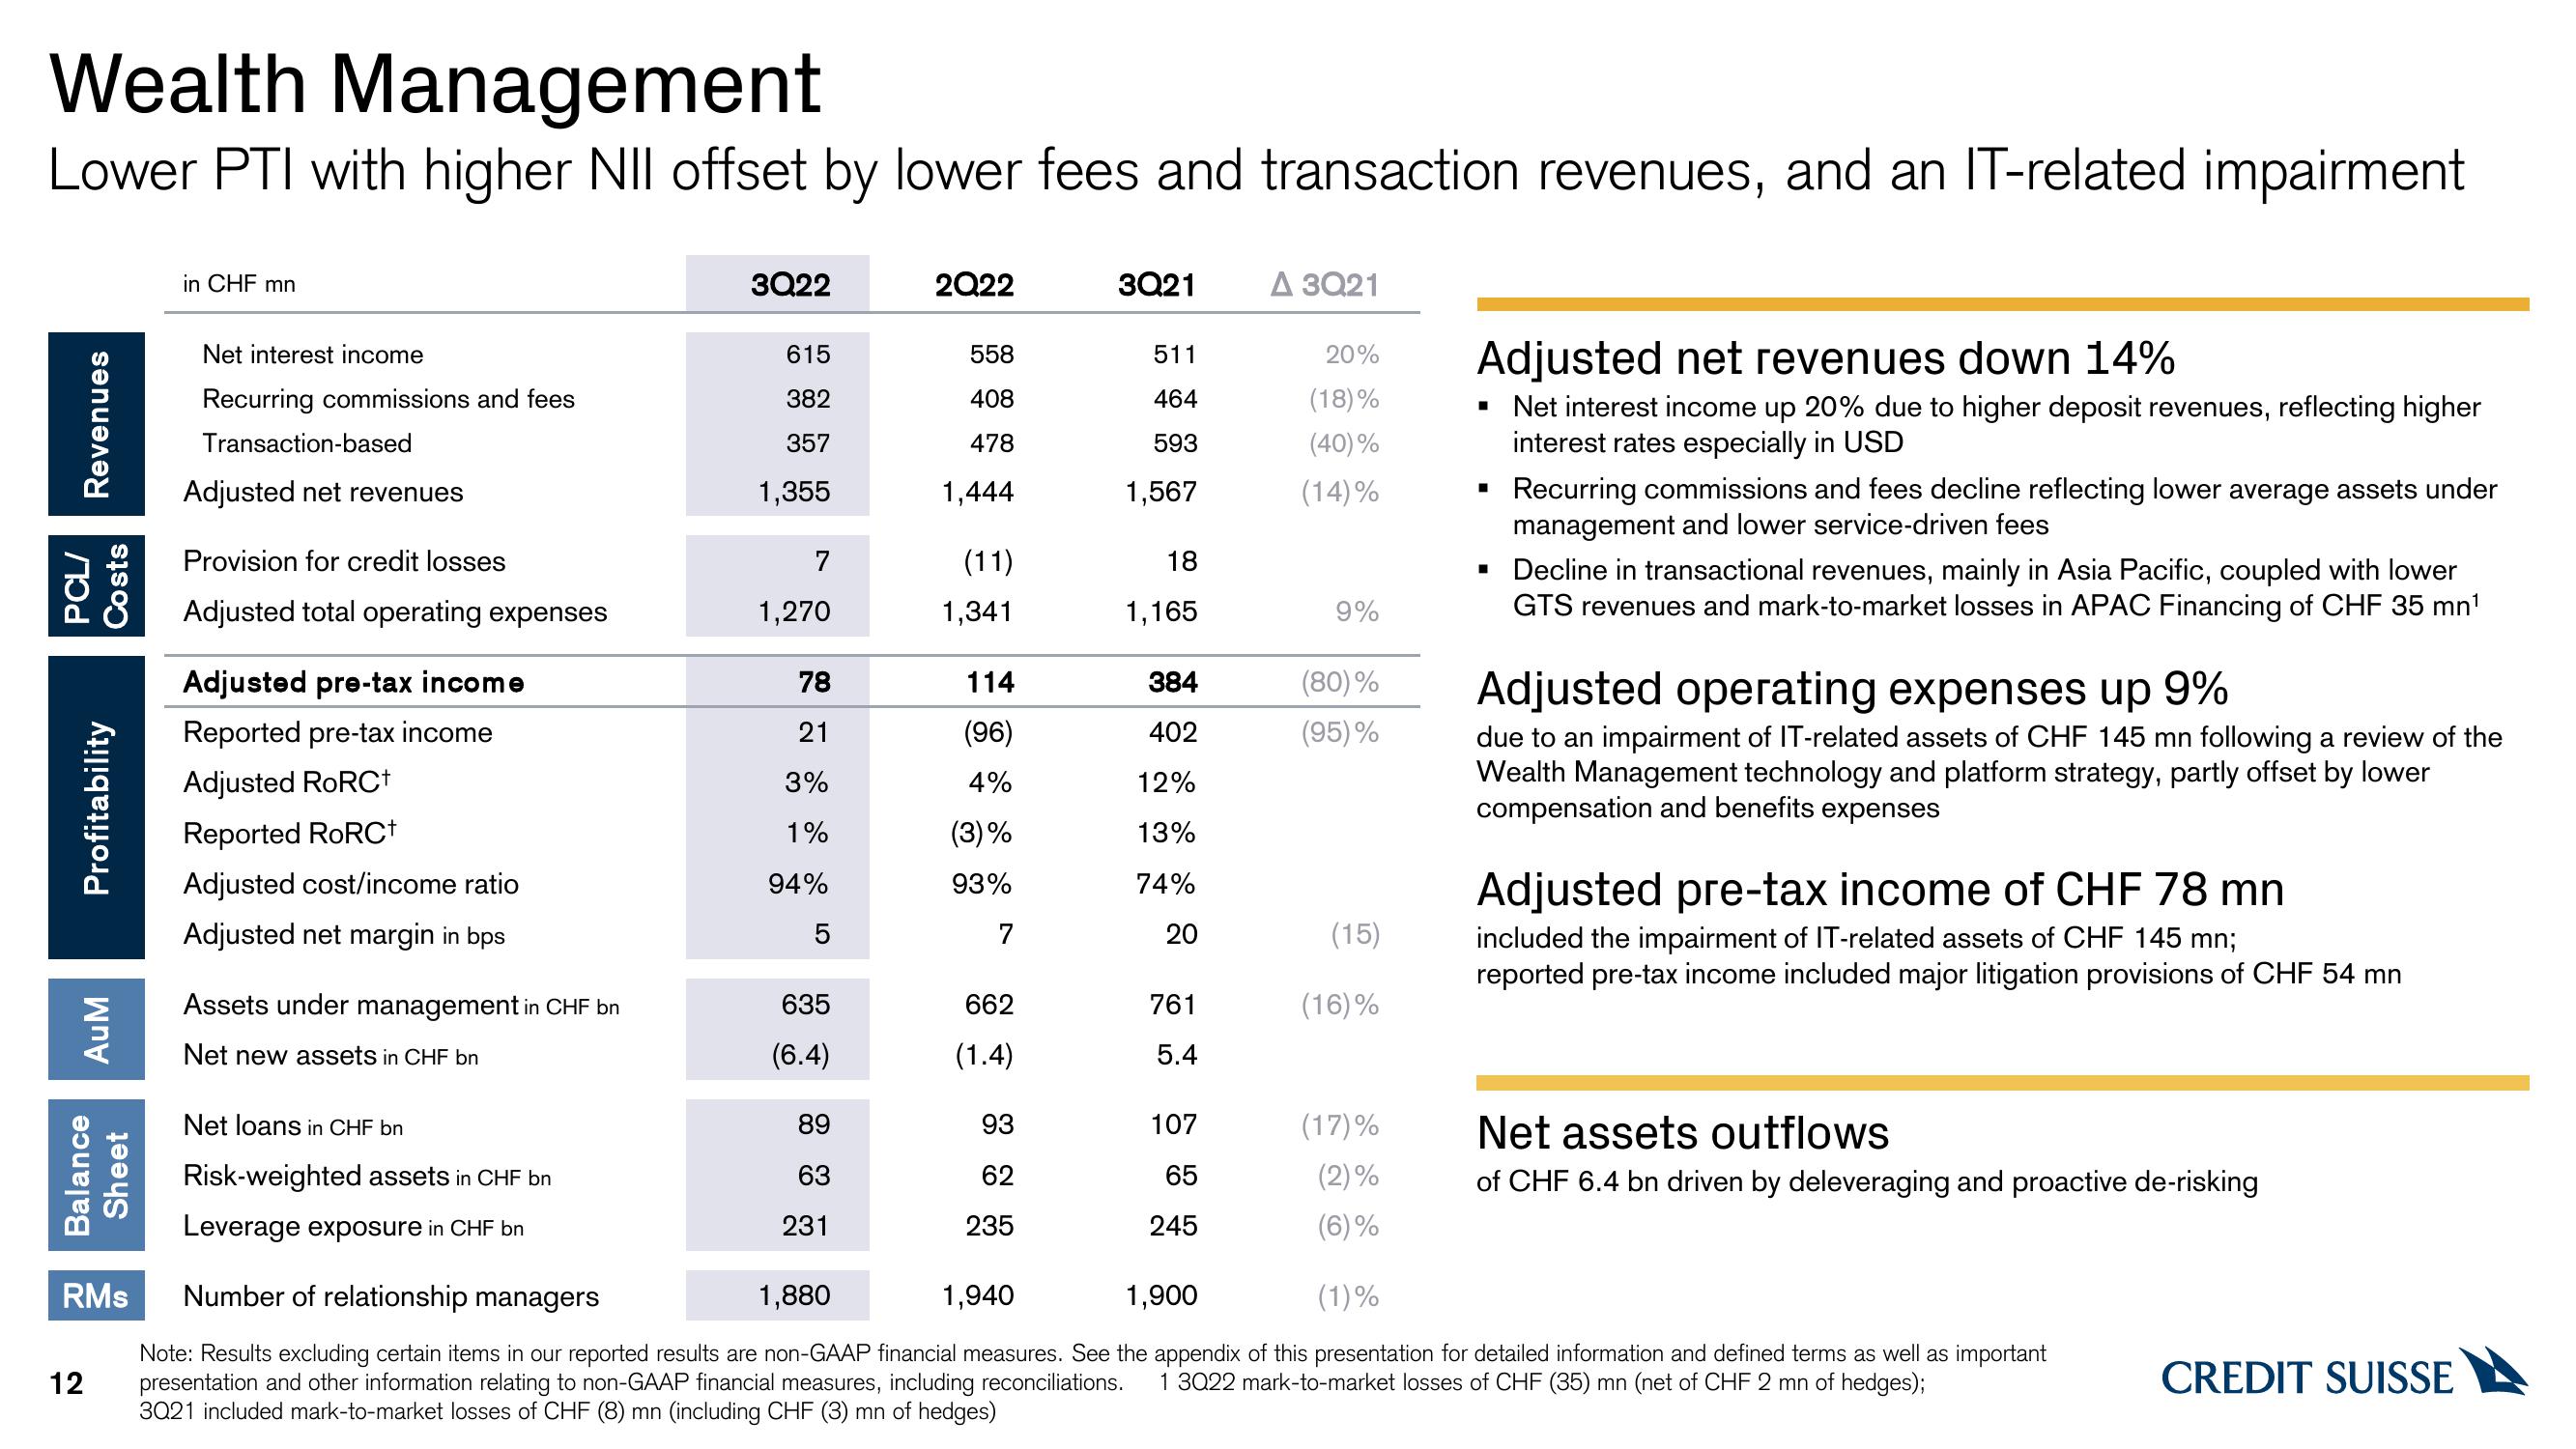
Adjusted net revenues down 14%
▪ Net interest income up 20% due to higher deposit revenues, reflecting higher
interest rates especially in USD
Recurring commissions and fees decline reflecting lower average assets under
management and lower service-driven fees
Decline in transactional revenues, mainly in Asia Pacific, coupled with lower
GTS revenues and mark-to-market losses in APAC Financing of CHF 35 mn¹
Adjusted operating expenses up 9%
due to an impairment of IT-related assets of CHF 145 mn following a review of the
Wealth Management technology and platform strategy, partly offset by lower
compensation and benefits expenses
Adjusted pre-tax income of CHF 78 mn
included the impairment of IT-related assets of CHF 145 mn;
reported pre-tax income included major litigation provisions of CHF 54 mn
Net assets outflows
of CHF 6.4 bn driven by deleveraging and proactive de-risking
RMs Number of relationship managers
1,880
1,940
1,900
(1)%
Note: Results excluding certain items in our reported results are non-GAAP financial measures. See the appendix of this presentation for detailed information and defined terms as well as important
presentation and other information relating to non-GAAP financial measures, including reconciliations. 1 3Q22 mark-to-market losses of CHF (35) mn (net of CHF 2 mn of hedges);
3021 included mark-to-market losses of CHF (8) mn (including CHF (3) mn of hedges)
CREDIT SUISSEView entire presentation