UBS Results Presentation Deck
Asset Management
USD m, except where indicated
Total revenues
Net management fees
Performance fees
Credit loss expense / (release)
Operating expenses
Profit before tax
Cost/income ratio
Invested assets, bn
Net new money, bn
UBS
3Q23
underlying
755
737
18
0
599
156
79%
1,559
(1)
3Q23
reported
755
737
18
0
724
31
96%
1,559
(1)
3Q23 underlying vs 2Q23 estimated underlying
USD bn
Total
revenues
Operating
expenses
Profit
before
tax
0.7
0.6
0.1
2Q23
0.8
0.6
0.2
3Q23
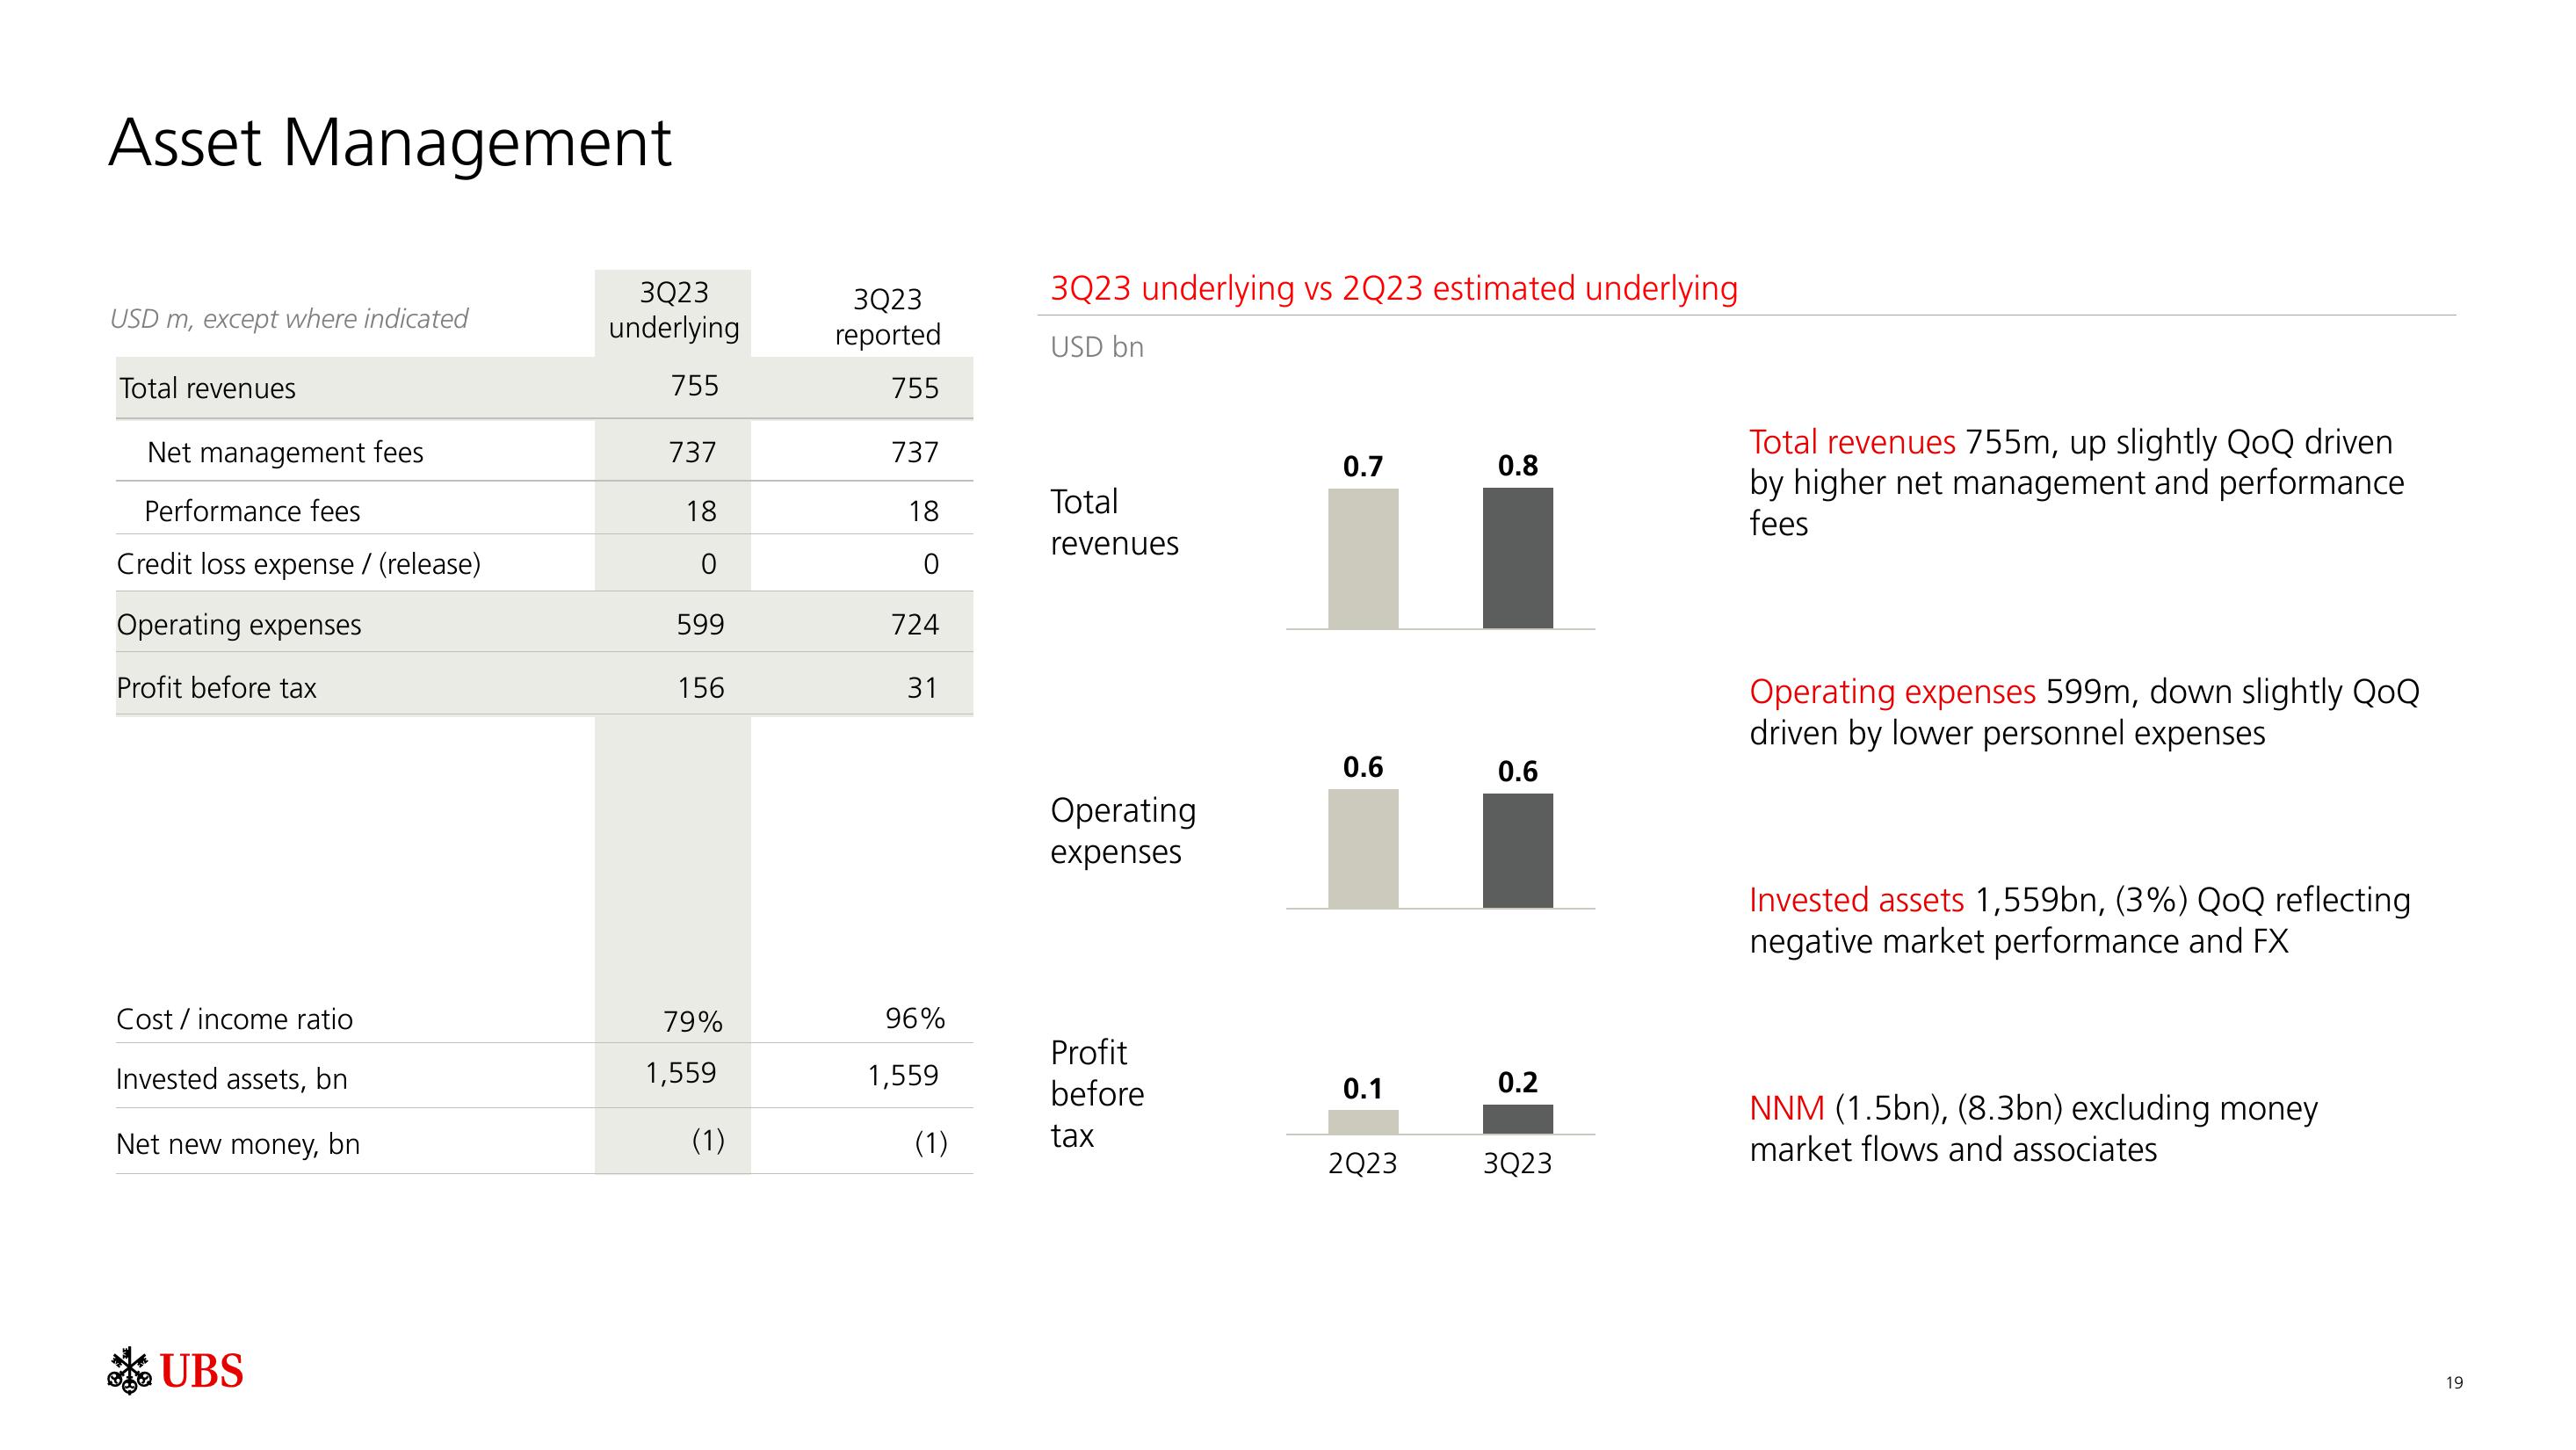
Total revenues 755m, up slightly QoQ driven
by higher net management and performance
fees
Operating expenses 599m, down slightly QoQ
driven by lower personnel expenses
Invested assets 1,559bn, (3%) QoQ reflecting
negative market performance and FX
NNM (1.5bn), (8.3bn) excluding money
market flows and associates
19View entire presentation