UBS Results Presentation Deck
Global Wealth Management
Recurring net fee income
m
2,128
2,341
+30%
2,468
2,629
2,774
2Q20 3Q20 4Q20 1Q21 2Q21
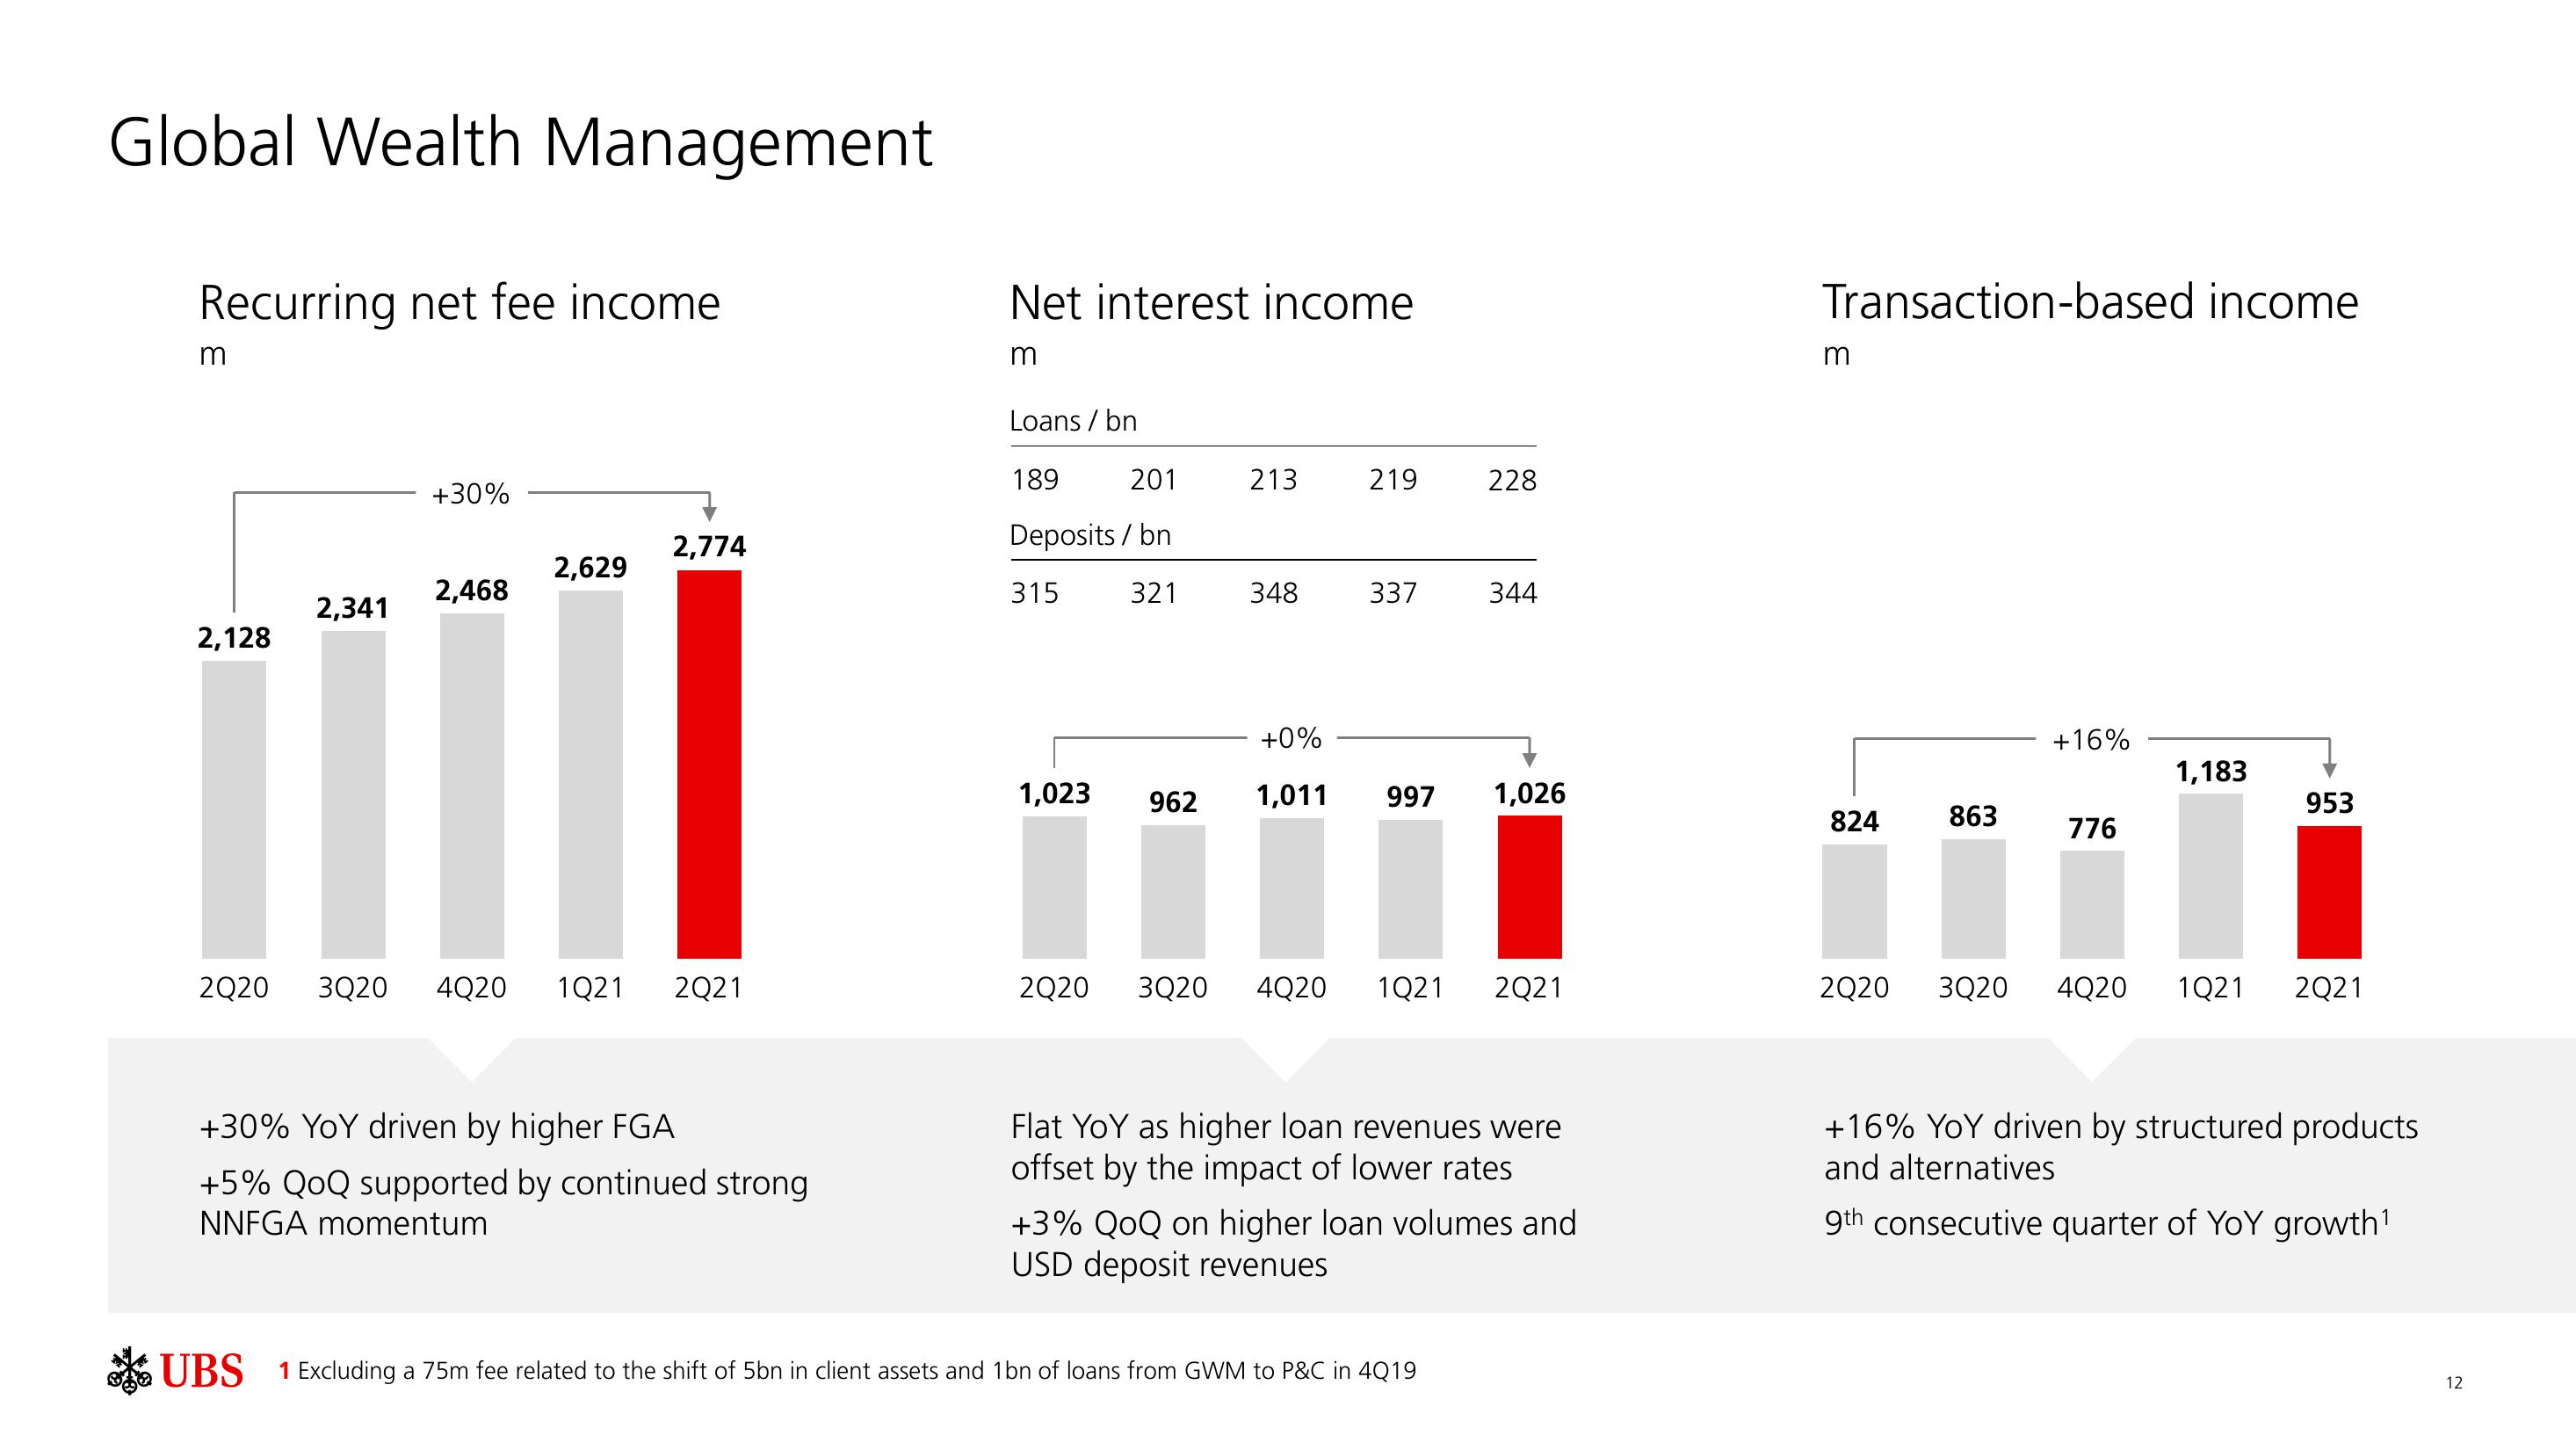
+30% YoY driven by higher FGA
+5% QOQ supported by continued strong
NNFGA momentum
Net interest income
m
Loans / bn
189
Deposits/bn
315
201
1,023
321
213
348
219
337
+0%
962 1,011 997
228
344
UBS 1 Excluding a 75m fee related to the shift of 5bn in client assets and 1bn of loans from GWM to P&C in 4Q19
1,026
2Q20 3Q20 4Q20 1Q21 2Q21
Flat YoY as higher loan revenues were
offset by the impact of lower rates
+3% QOQ on higher loan volumes and
USD deposit revenues
Transaction-based income
m
824
863
+16%
776
1,183
953
2Q20 3Q20 4Q20 1Q21 2Q21
+16% YoY driven by structured products
and alternatives
9th consecutive quarter of YoY growth¹
12View entire presentation