Roblox Results Presentation Deck
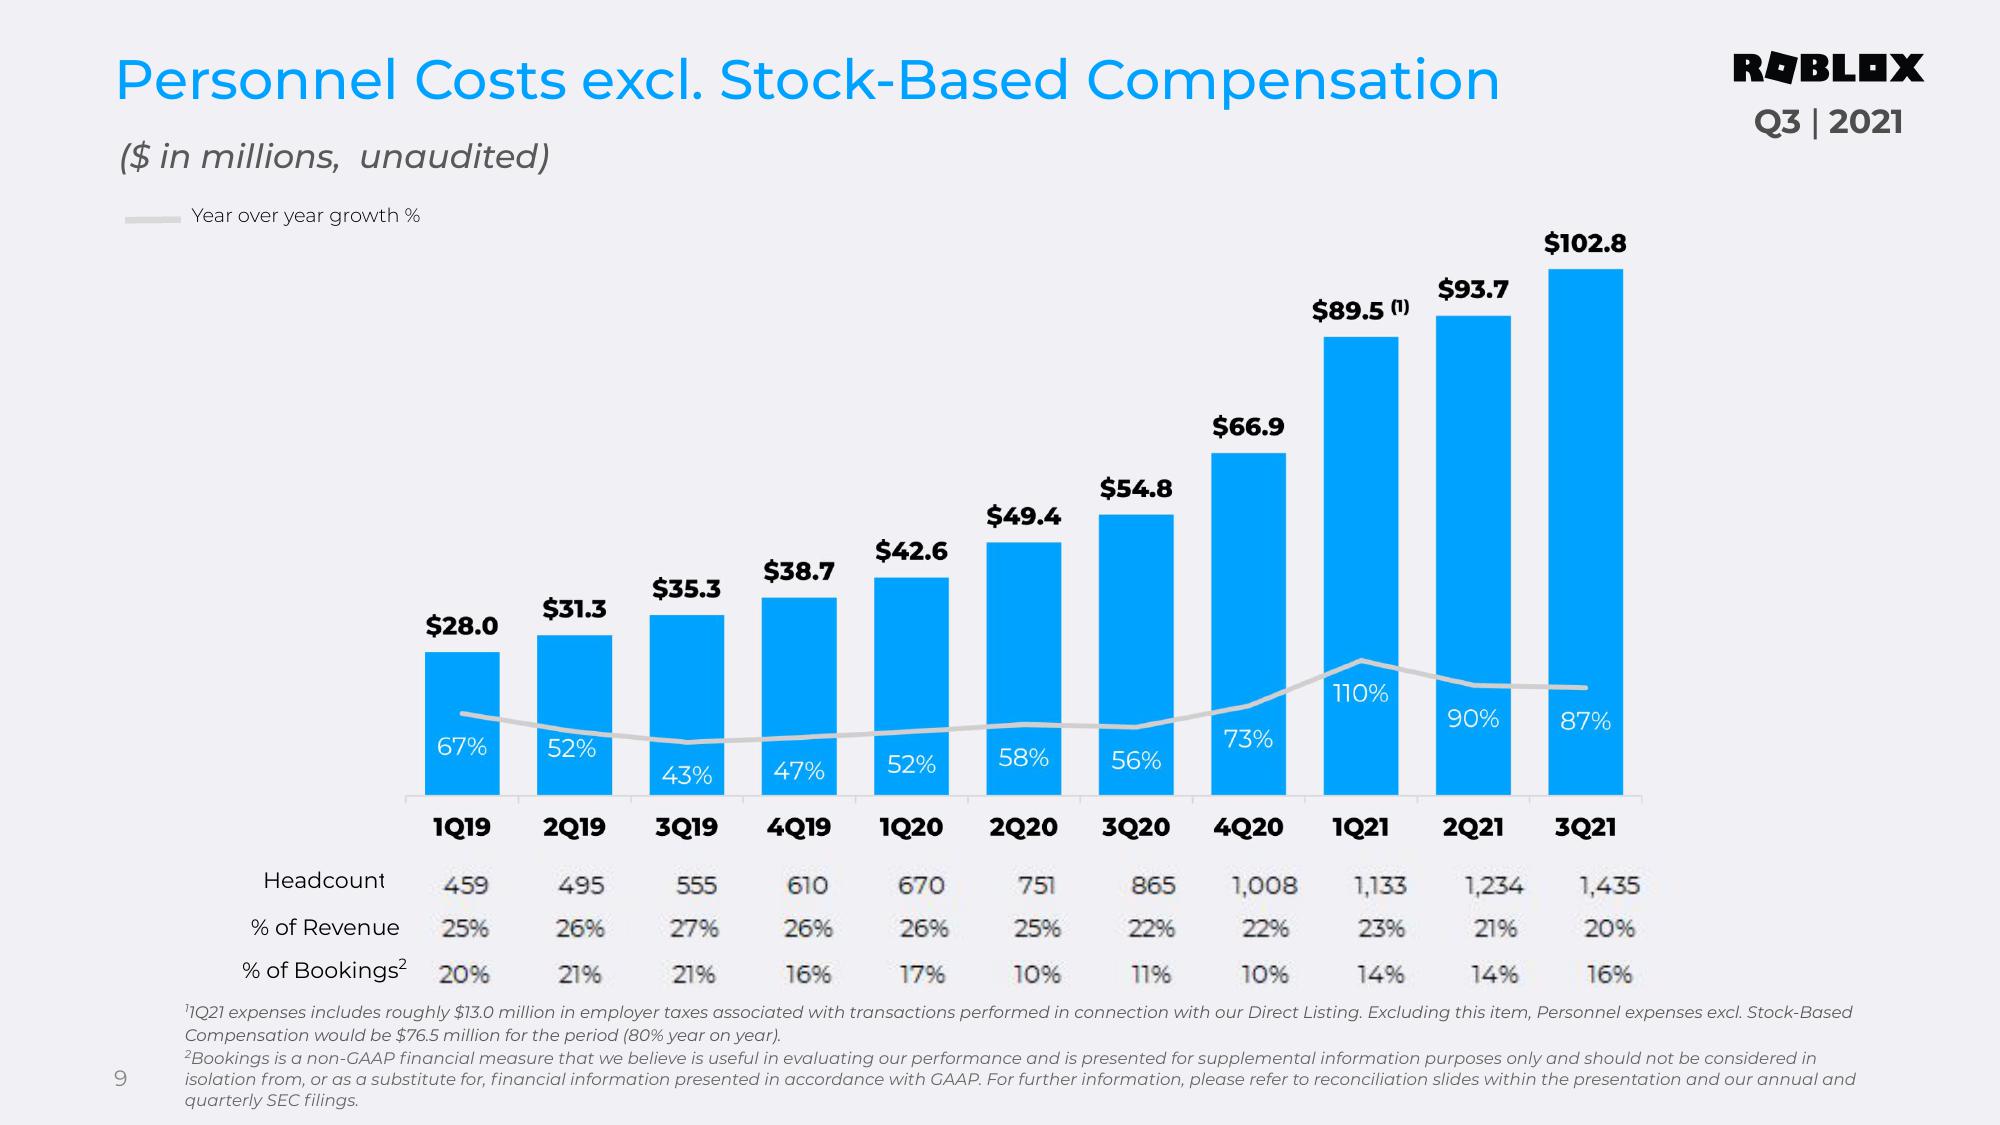
Personnel Costs excl. Stock-Based Compensation
($ in millions, unaudited)
Year over year growth %
9
Headcount
$28.0
67%
1Q19
$31.3
52%
$35.3
$38.7
47%
555
27%
$42.6
52%
610
26%
$49.4
58%
670
26%
$54.8
56%
$66.9
73%
$89.5 (¹)
110%
1,008
22%
$93.7
43%
2Q19 3Q19 4Q19 1Q20 2Q20 3Q20 4Q20 1Q21 2Q21 3Q21
90%
459
495
751
865
1,133 1,234
1,435
% of Revenue 25%
26%
25%
22%
23%
21%
20%
21%
21%
16%
17%
10%
11%
10%
14%
14%
16%
% of Bookings² 20%
¹1Q21 expenses includes roughly $13.0 million in employer taxes associated with transactions performed in connection with our Direct Listing. Excluding this item, Personnel expenses excl. Stock-Based
Compensation would be $76.5 million for the period (80% year on year).
²Bookings is a non-GAAP financial measure that we believe is useful in evaluating our performance and is presented for supplemental information purposes only and should not be considered in
isolation from, or as a substitute for, financial information presented in accordance with GAAP. For further information, please refer to reconciliation slides within the presentation and our annual and
quarterly SEC filings.
$102.8
87%
ROBLOX
Q3 | 2021View entire presentation