Credit Suisse Investment Banking Pitch Book
CONFIDENTIAL
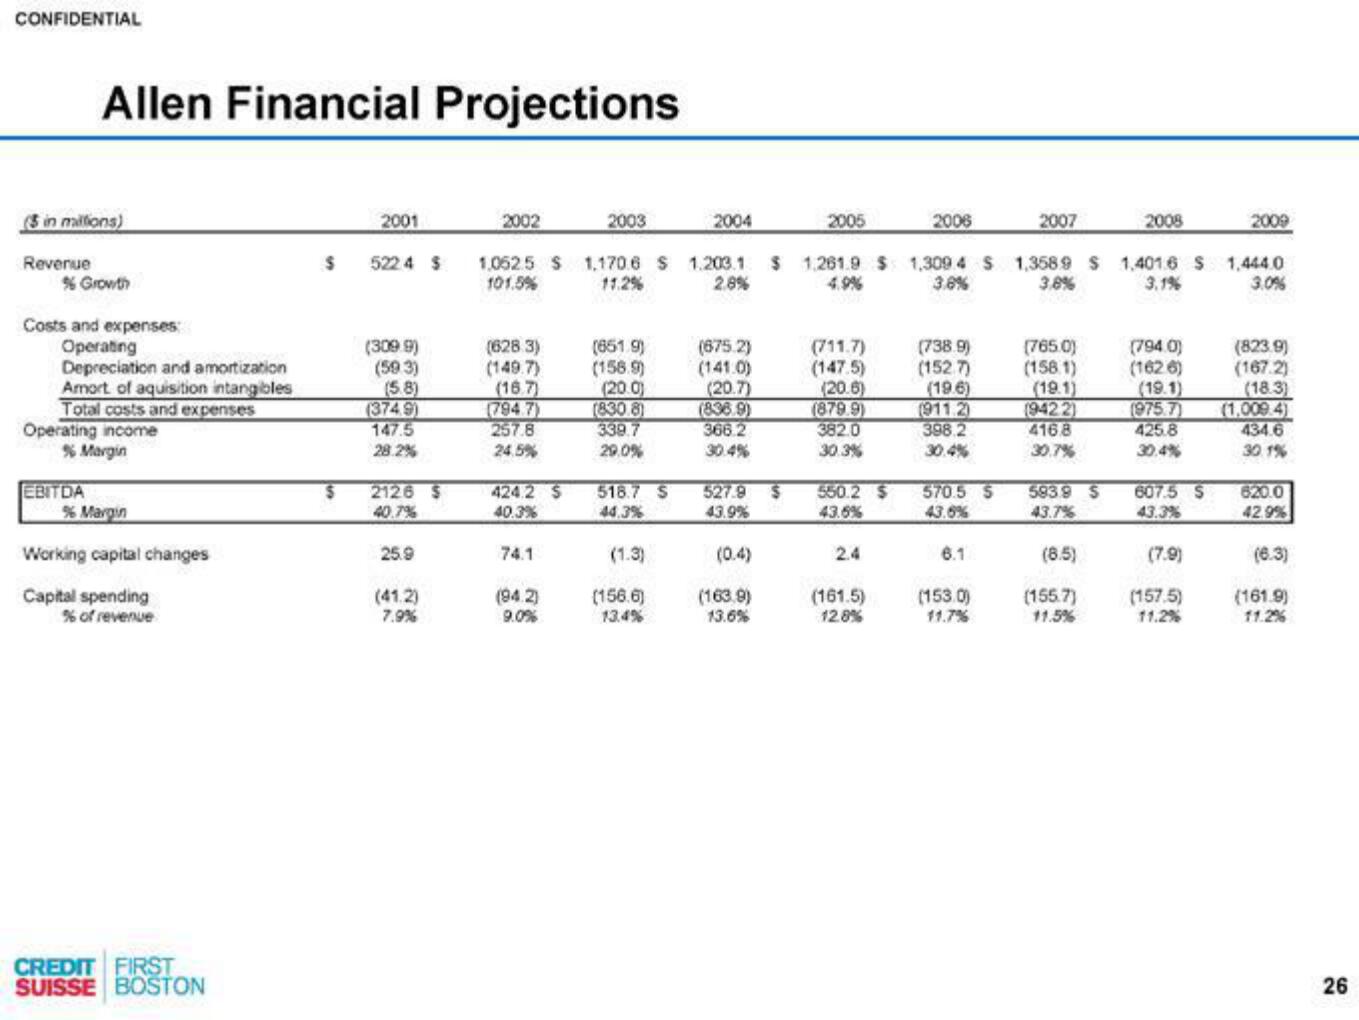
Allen Financial Projections
(3 in millions)
Revenue
% Growth
Costs and expenses
Operating
Depreciation and amortization
Amort of aquisition intangibles
Total costs and expenses
Operating income
% Margin
EBITDA
% Margin
Working capital changes
Capital spending
% of revenue
CREDIT FIRST
SUISSE BOSTON
2001
(3099)
(593)
(5.8)
(374.9)
147.5
28.2%
$ 2126 $
40.7%
$ 5224 S 1,0525 $ 1,170.6 $ 1.203.1
101.5%
11.2%
2.8%
25.9
2002
(41.2)
7.9%
(628.3)
(149.7)
(16.7)
257.8
24.5%
424.2 S
40.3%
74.1
2003
(94.2)
9.0%
(661.9)
(158.9)
(20.0)
(830.8)
339.7
29.0%
518.7 S
44.3%
(1.3)
2004
(156.6)
13.4%
(675.2)
(141.0)
(20.7)
(838.9)
366.2
30.4%
(0.4)
2005
(163.9)
13.6%
(711.7)
(147.5)
(20.6)
(879.9)
527.9 $ 550.2 $
43.9%
43.6%
382.0
30.3%
$ 1.261.9 $ 1,309.4 $ 1,3589 $ 1.4016 S 1,444.0
4.9%
3.8%
3.8%
3.1%
3.0%
2.4
2006
(161.5)
12.8%
(738.9)
(152.7)
(19.6)
(911.2)
398.2
30.4%
570.5 S
43.6%
6.1
2007
(153.0)
(765.0)
(158.1)
(19.1)
(9422)
416.8
30.7%
593.9 S
43.7%
2008
(8.5)
(155.7)
11.5%
(794.0)
(1626)
(19.1)
(975.7)
425.8
30.4%
607.5 S
43.3%
(7.9)
2009
(157.5)
11.2%
(823.9)
(167.2)
(18.3)
(1,009.4)
434.6
30.1%
620.0
42.9%
(6.3)
(161.9)
11.2%
26View entire presentation