Investor Presentation
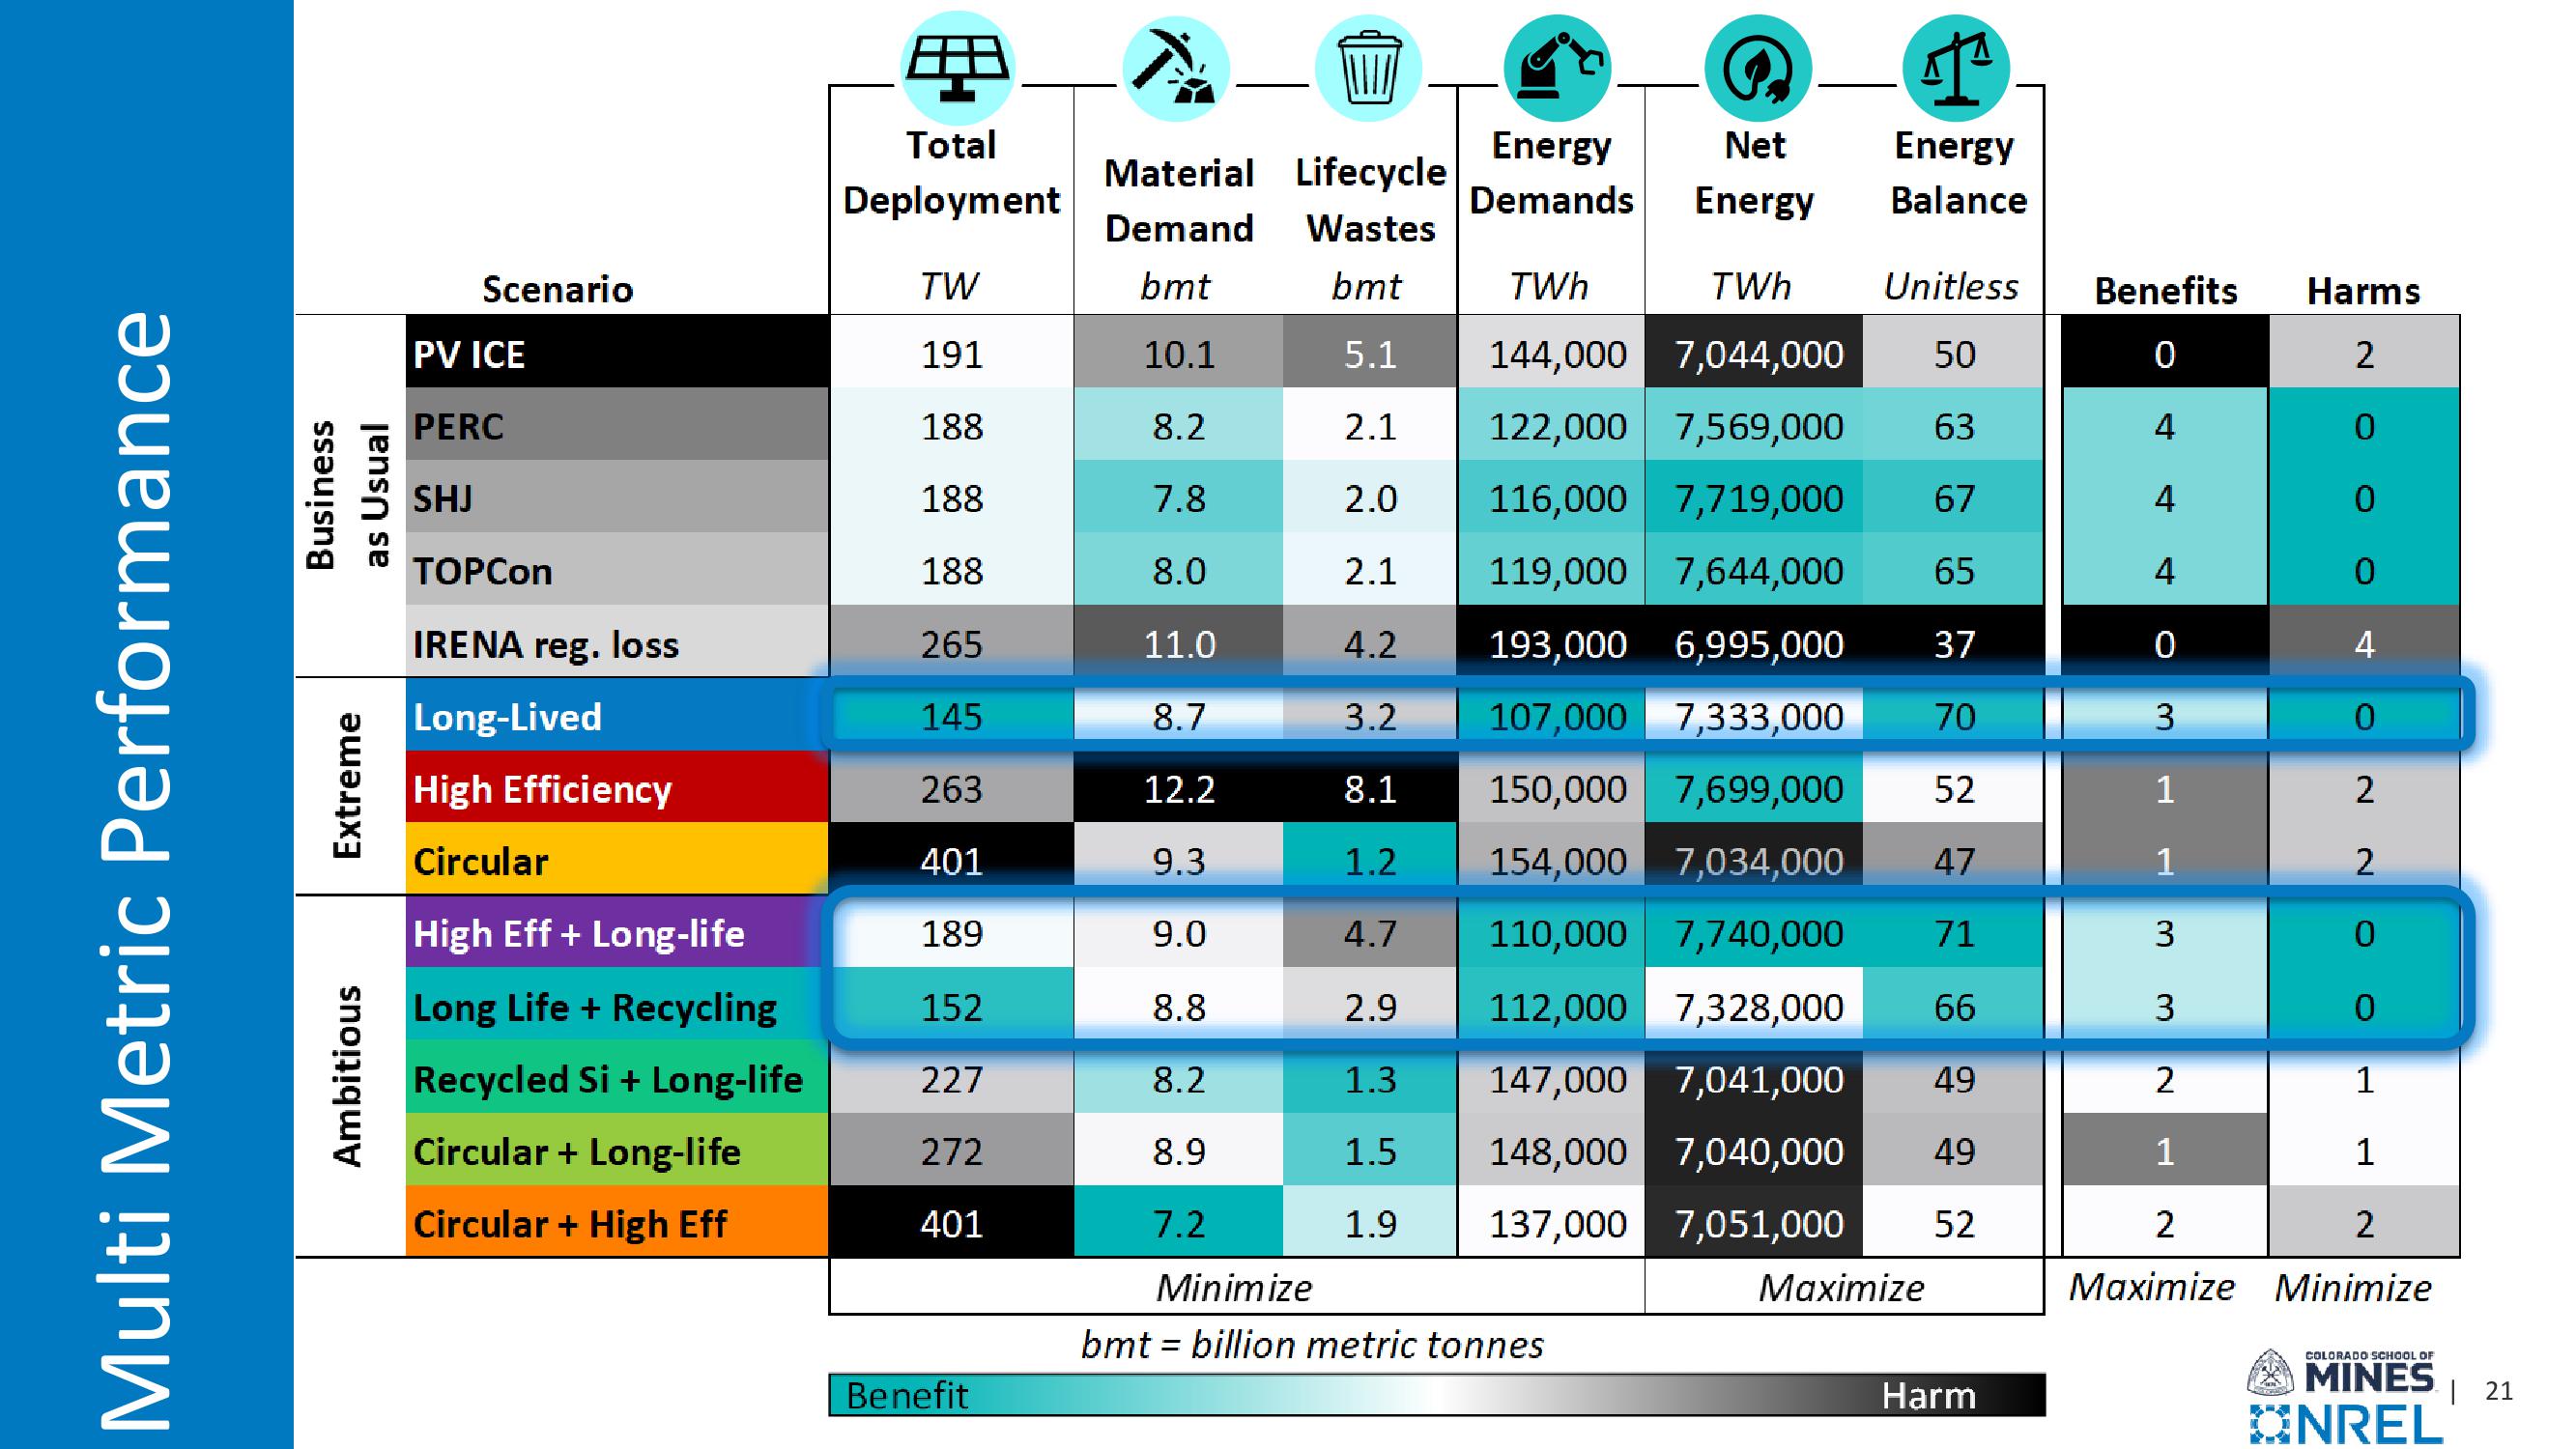
Multi Metric Performance
Ambitious
Extreme
Business
as Usual
P
Total
Deployment
Scenario
TW
bmt
Material Lifecycle
Demand Wastes
bmt
Energy
Net Energy
Demands Energy Balance
PV ICE
191
10.1
5.1
TWh
TWh Unitless
144,000 7,044,000 50
Benefits Harms
0
2
PERC
SHJ
TOPCon
188
8.2
2.1
122,000 7,569,000 63
4
0
188
7.8
2.0
116,000 7,719,000 67
4
0
188
8.0
2.1
119,000 7,644,000 65
4
0
IRENA reg. loss
265
11.0
4.2
193,000 6,995,000 37
0
4
Long-Lived
145
8.7
3.2
107,000 7,333,000
70
3
0
High Efficiency
263
12.2
8.1
150,000 7,699,000
52
Circular
401
9.3
1.2
154,000 7,034,000 47
1
High Eff + Long-life
189
9.0
4.7
110,000 7,740,000 71
3
2 2 O
0
Long Life + Recycling
152
8.8
2.9
112,000 7,328,000 66
3
0
Recycled Si + Long-life
227
8.2
1.3
147,000 7,041,000
49
2
1
Circular + Long-life
272
8.9
1.5
148,000 7,040,000 49
1
Circular + High Eff
401
7.2
1.9
137,000 7,051,000 52
Minimize
Maximize
2
Maximize Minimize
2
bmt = billion metric tonnes
Benefit
Harm
COLORADO SCHOOL OF
MINES
ONREL
| 21View entire presentation