Global Beverage Trade and Company Overviews
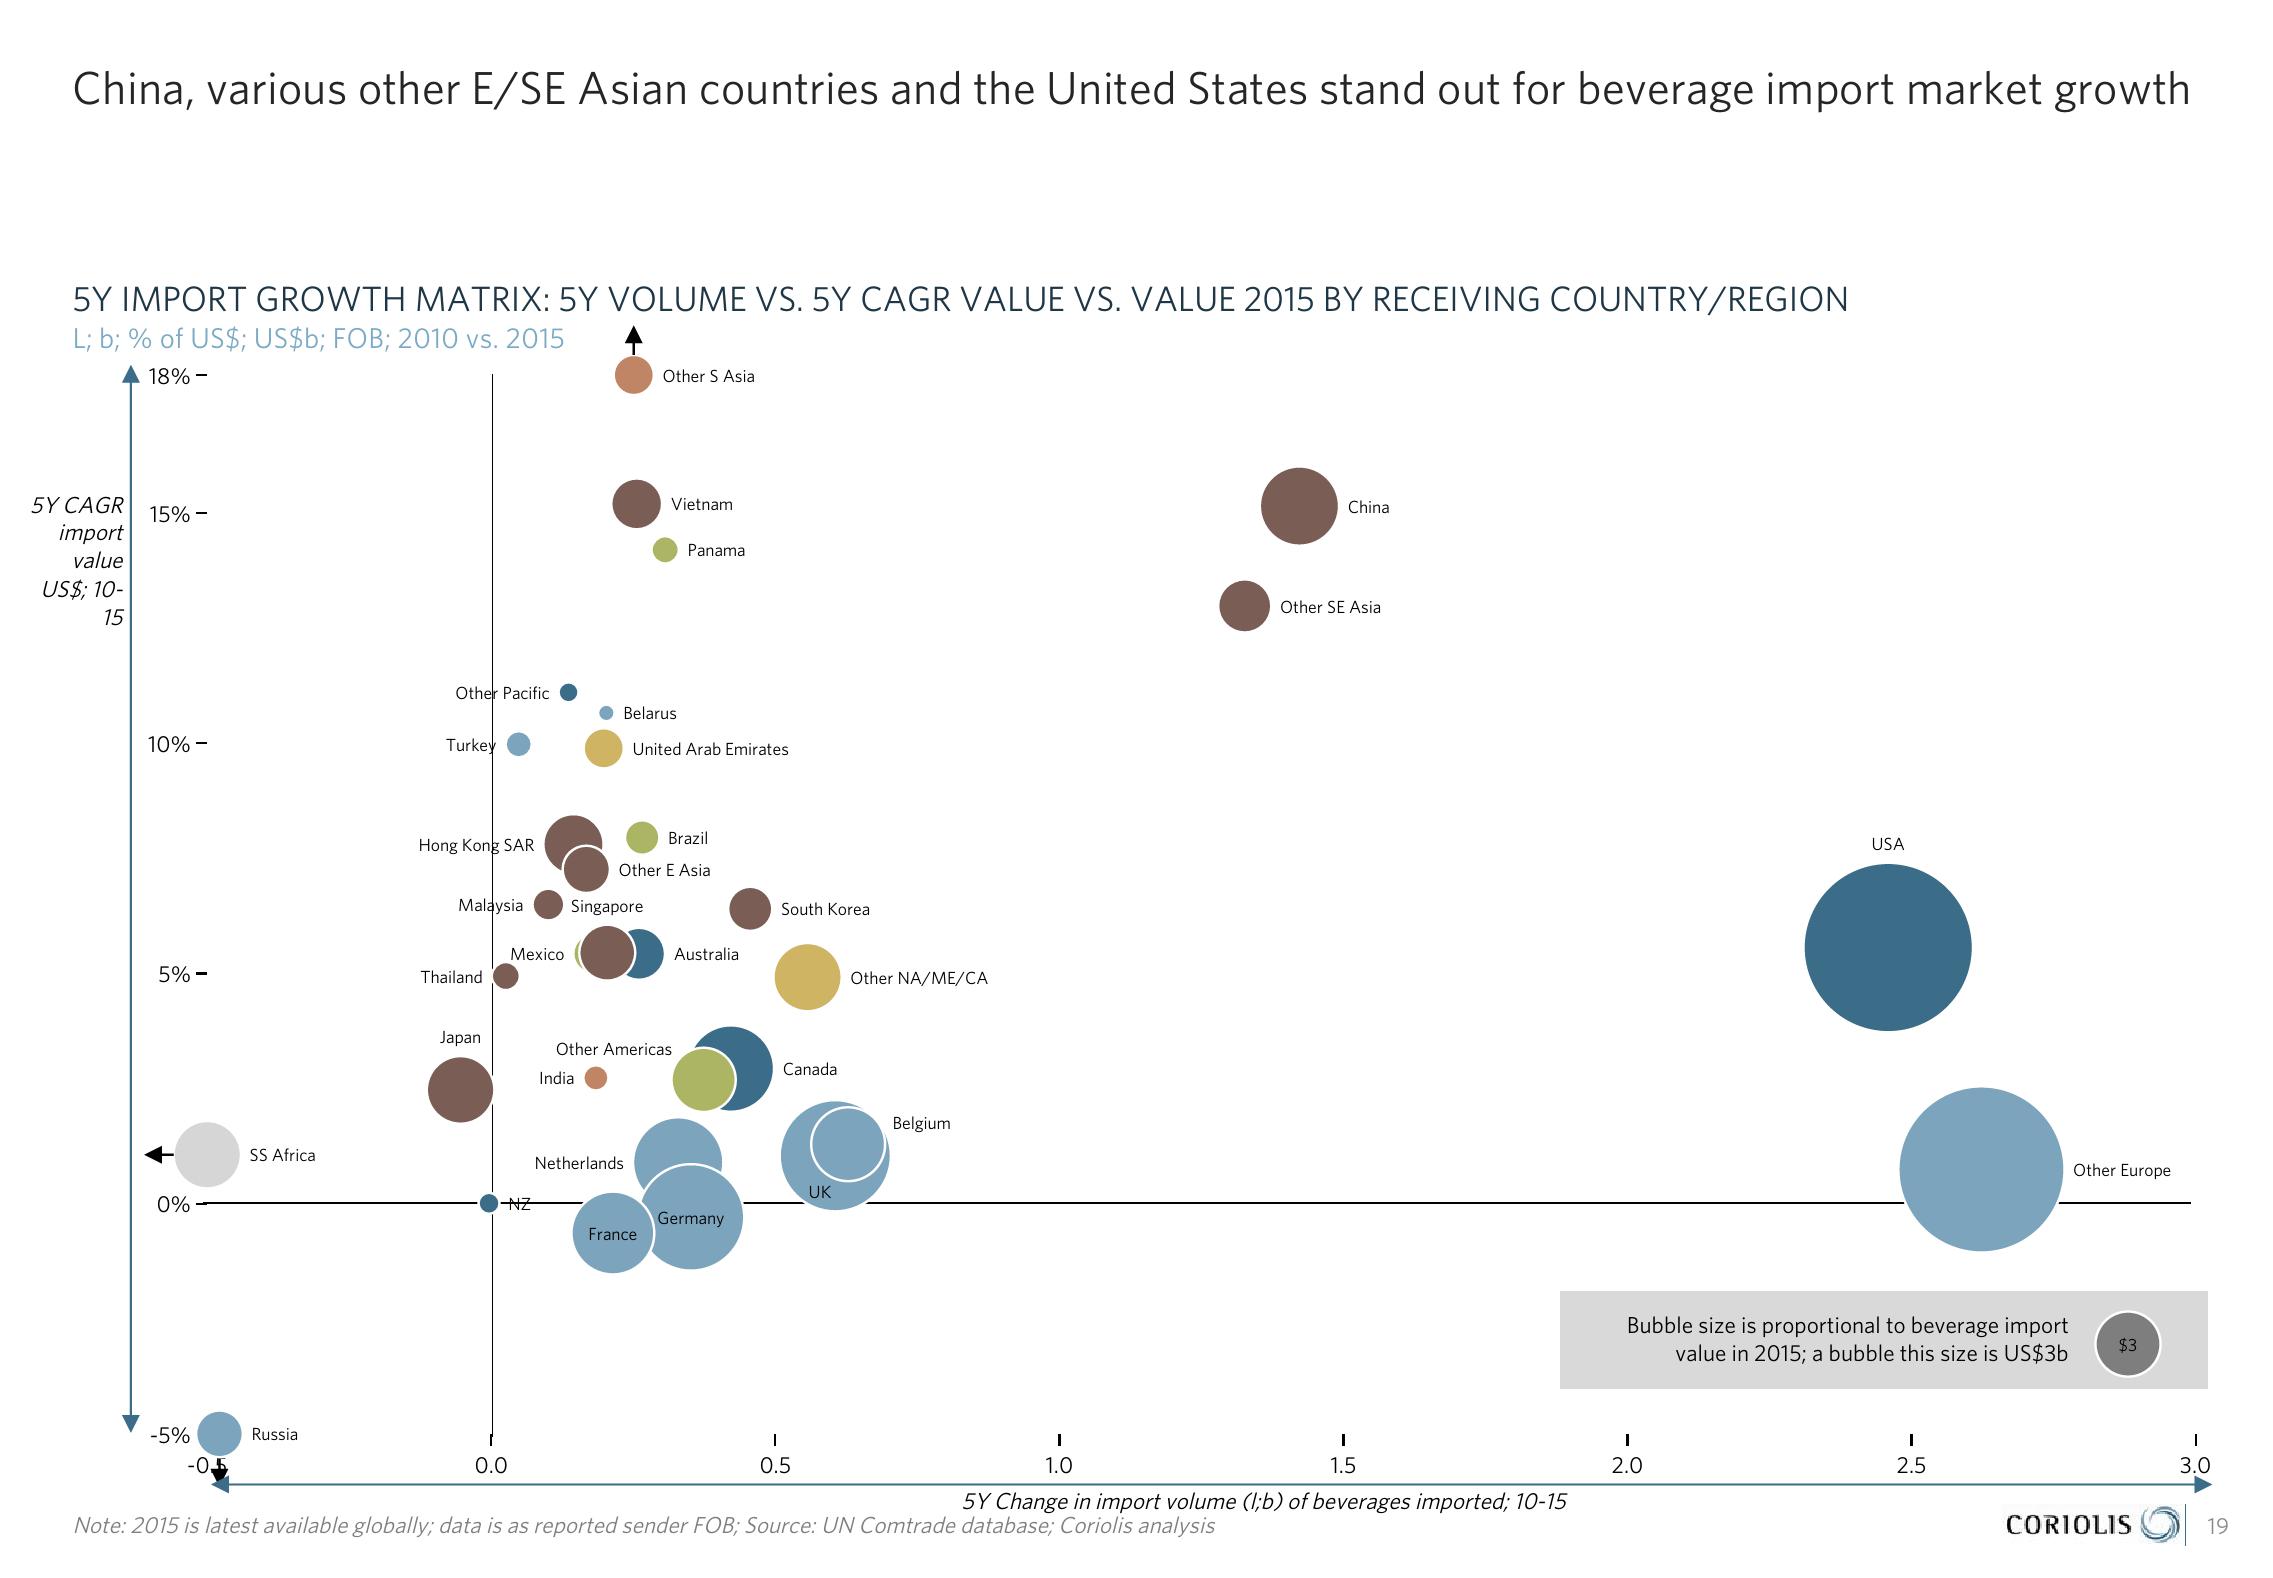
China, various other E/SE Asian countries and the United States stand out for beverage import market growth
5Y IMPORT GROWTH MATRIX: 5Y VOLUME VS. 5Y CAGR VALUE VS. VALUE 2015 BY RECEIVING COUNTRY/REGION
L; b; % of US$; US$b; FOB; 2010 vs. 2015
18%-
Other S Asia
5Y CAGR
import
value
US$; 10-
15
15%-
Other Pacific
Belarus
10%-
Turkey
Hong Kong SAR
Vietnam
Panama
United Arab Emirates
Brazil
Other E Asia
Malaysia
Singapore
South Korea
Mexico
Australia
5%-
Thailand
SS Africa
0%
-5%
Russia
-0.5
Japan
Other Americas
Canada
India
0.0
Netherlands
UK
Germany
France
I
0.5
Other NA/ME/CA
Belgium
China
Other SE Asia
USA
Other Europe
Bubble size is proportional to beverage import
value in 2015; a bubble this size is US$3b
$3
I
1.0
1.5
2.0
5Y Change in import volume (l;b) of beverages imported; 10-15
Note: 2015 is latest available globally; data is as reported sender FOB; Source: UN Comtrade database; Coriolis analysis
I
2.5
I
3.0
CORIOLIS
19View entire presentation