ANZ 2022 Full Year Results
ANZ 2022 Full Year Results
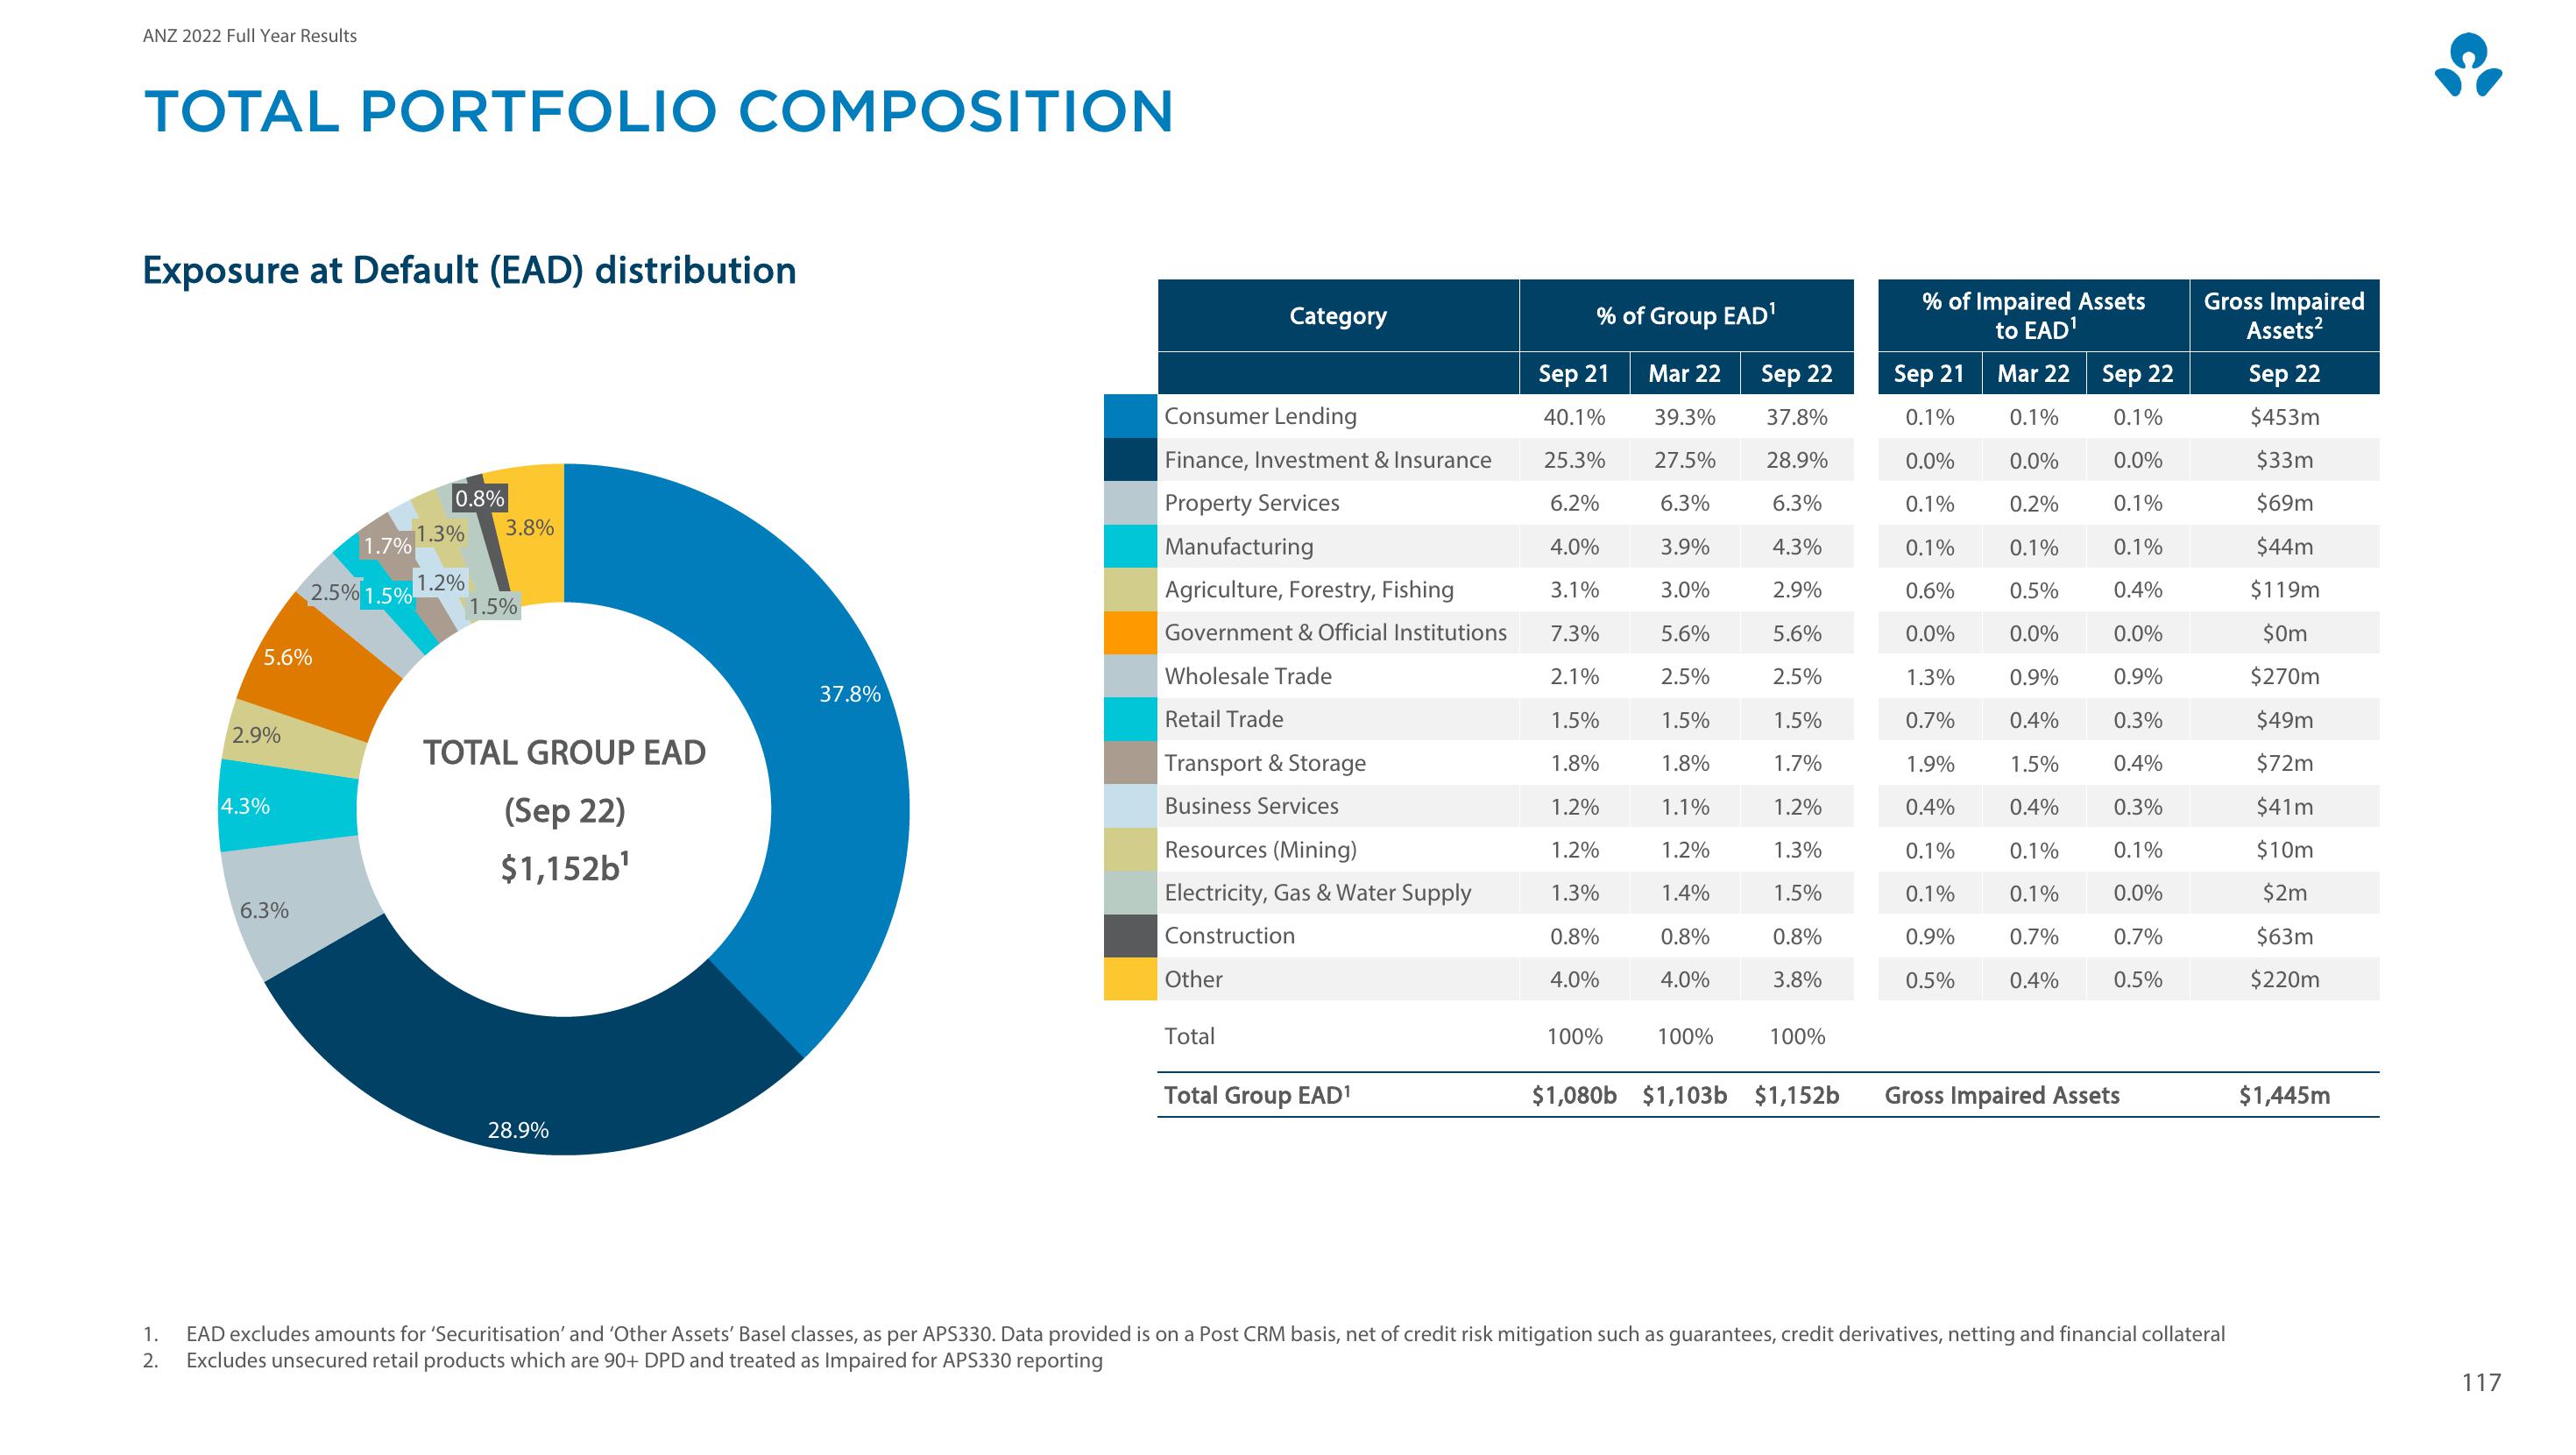
TOTAL PORTFOLIO COMPOSITION
Exposure at Default (EAD) distribution
1.
2.
Category
% of Group EAD¹
% of Impaired Assets
Gross Impaired
to EAD¹
Assets²
Sep 21
Mar 22
Sep 22
Sep 21
Mar 22
Sep 22
Sep 22
Consumer Lending
40.1%
39.3%
37.8%
0.1%
0.1%
0.1%
$453m
Finance, Investment & Insurance
25.3%
27.5%
28.9%
0.0%
0.0%
0.0%
$33m
0.8%
1.3%
3.8%
1.7%
1.2%
2.5% 1.5%
1.5%
Property Services
6.2%
6.3%
6.3%
0.1%
0.2%
0.1%
$69m
Manufacturing
4.0%
3.9%
4.3%
0.1%
0.1%
0.1%
$44m
Agriculture, Forestry, Fishing
3.1%
3.0%
2.9%
0.6%
0.5%
0.4%
$119m
Government & Official Institutions
7.3%
5.6%
5.6%
0.0%
0.0%
0.0%
$0m
5.6%
Wholesale Trade
2.1%
2.5%
2.5%
1.3%
0.9%
0.9%
$270m
37.8%
Retail Trade
1.5%
1.5%
1.5%
0.7%
0.4%
0.3%
2.9%
$49m
TOTAL GROUP EAD
Transport & Storage
1.8%
1.8%
1.7%
1.9%
1.5%
0.4%
$72m
4.3%
(Sep 22)
$1,152b¹
Business Services
1.2%
1.1%
1.2%
0.4%
0.4%
0.3%
$41m
Resources (Mining)
1.2%
1.2%
1.3%
0.1%
0.1%
0.1%
$10m
Electricity, Gas & Water Supply
1.3%
1.4%
1.5%
0.1%
0.1%
0.0%
$2m
6.3%
Construction
0.8%
0.8%
0.8%
0.9%
0.7%
0.7%
$63m
Other
4.0%
4.0%
3.8%
0.5%
0.4%
0.5%
$220m
Total
100%
100%
100%
Total Group EAD¹
$1,080b $1,103b $1,152b
Gross Impaired Assets
$1,445m
28.9%
EAD excludes amounts for 'Securitisation' and 'Other Assets' Basel classes, as per APS330. Data provided is on a Post CRM basis, net of credit risk mitigation such as guarantees, credit derivatives, netting and financial collateral
Excludes unsecured retail products which are 90+ DPD and treated as Impaired for APS330 reporting
117View entire presentation