Ulta Beauty Investor Presentation Deck
Recent Financial
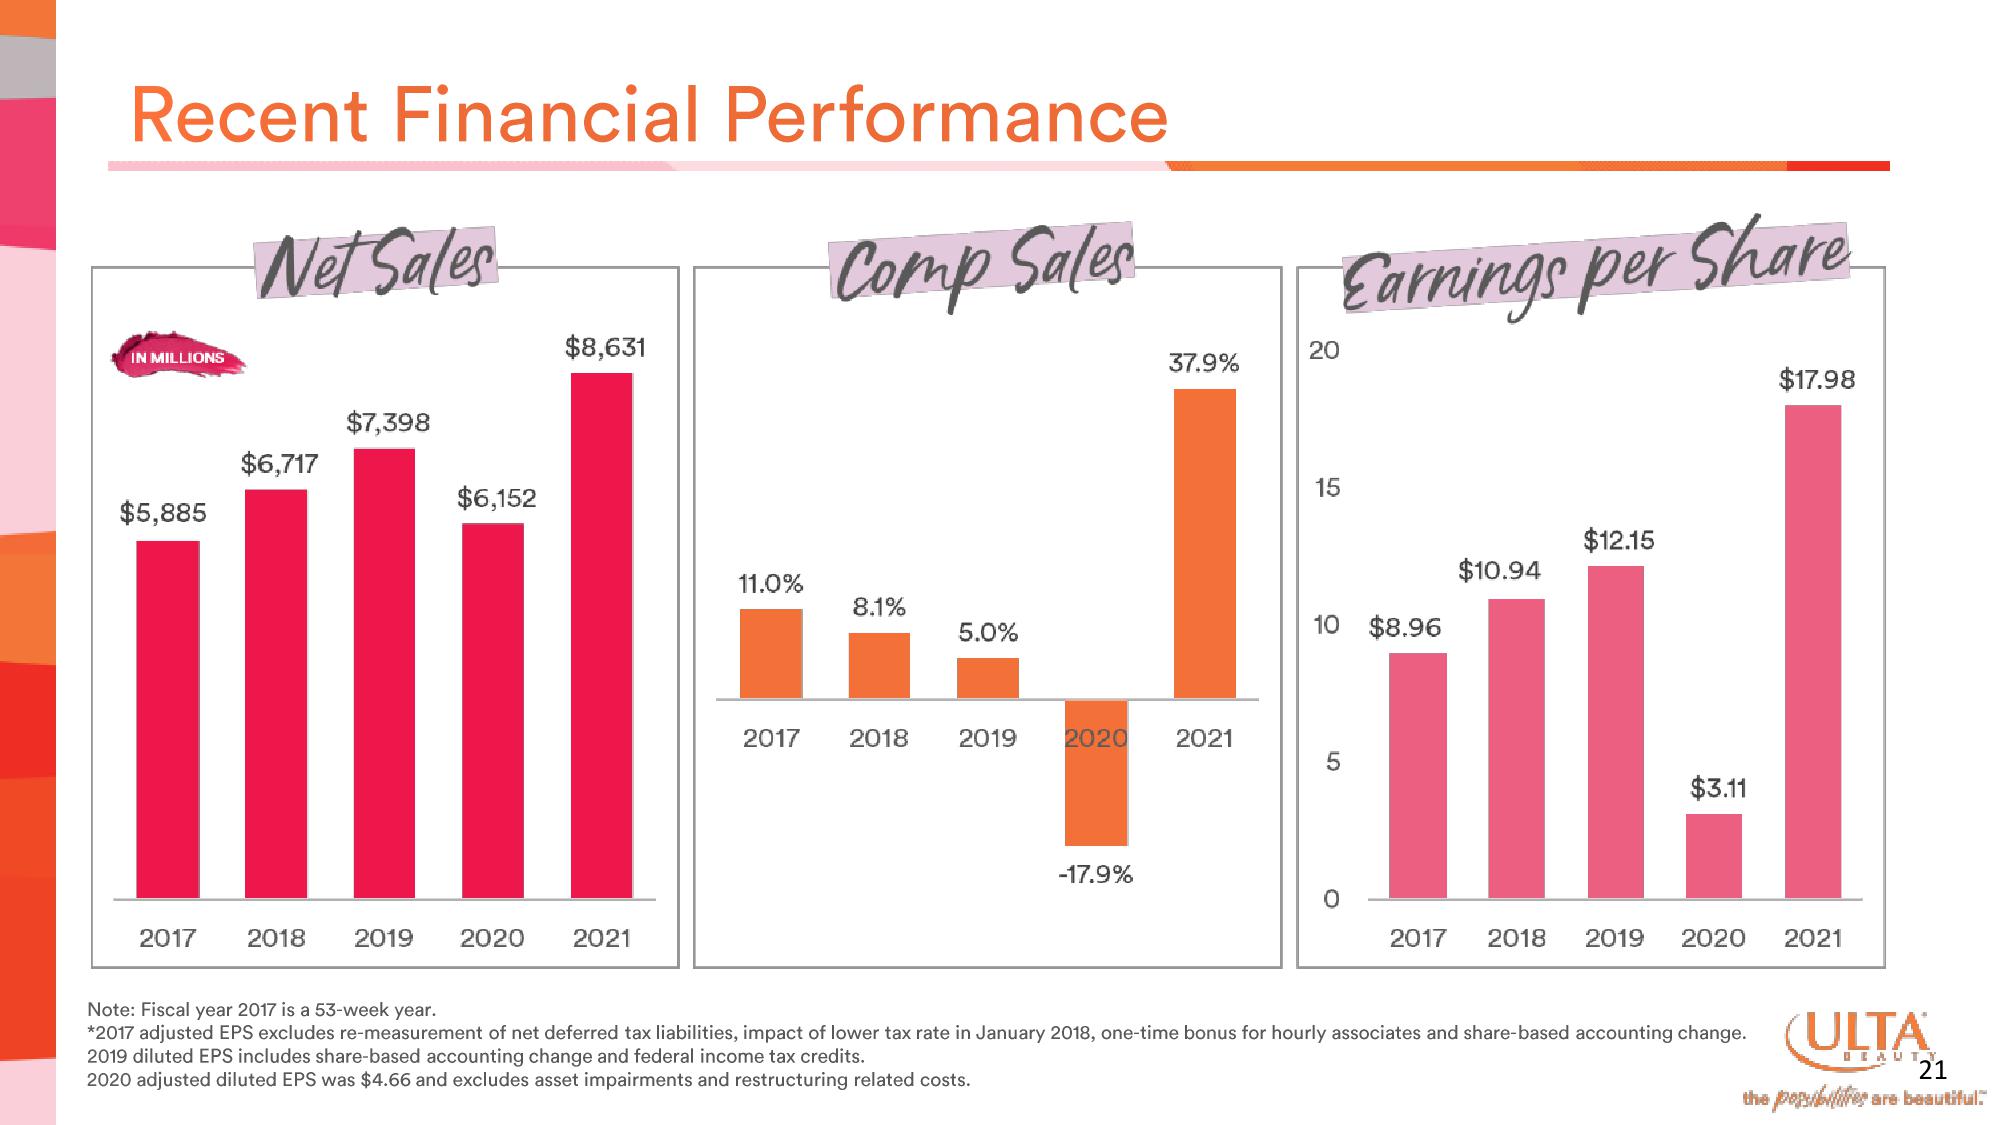
-Net Sales
IN MILLIONS
$5,885
$6,717
$7,398
$6,152
2017 2018 2019 2020
$8,631
2021
Performance
·Comp Sales
11.0%
8.1%
5.0%
37.9%
2017 2018 2019 2020 2021
-17.9%
Earnings per Share
20
15
10 $8.96
LO
5
0
$10.94
$12.15
$3.11
2017 2018 2019 2020
Note: Fiscal year 2017 is a 53-week year.
*2017 adjusted EPS excludes re-measurement of net deferred tax liabilities, impact of lower tax rate in January 2018, one-time bonus for hourly associates and share-based accounting change.
2019 diluted EPS includes share-based accounting change and federal income tax credits.
2020 adjusted diluted EPS was $4.66 and excludes asset impairments and restructuring related costs.
$17.98
2021
(ULTA
BEAUTY
21
the possibilities are beautiful.View entire presentation