Wix Results Presentation Deck
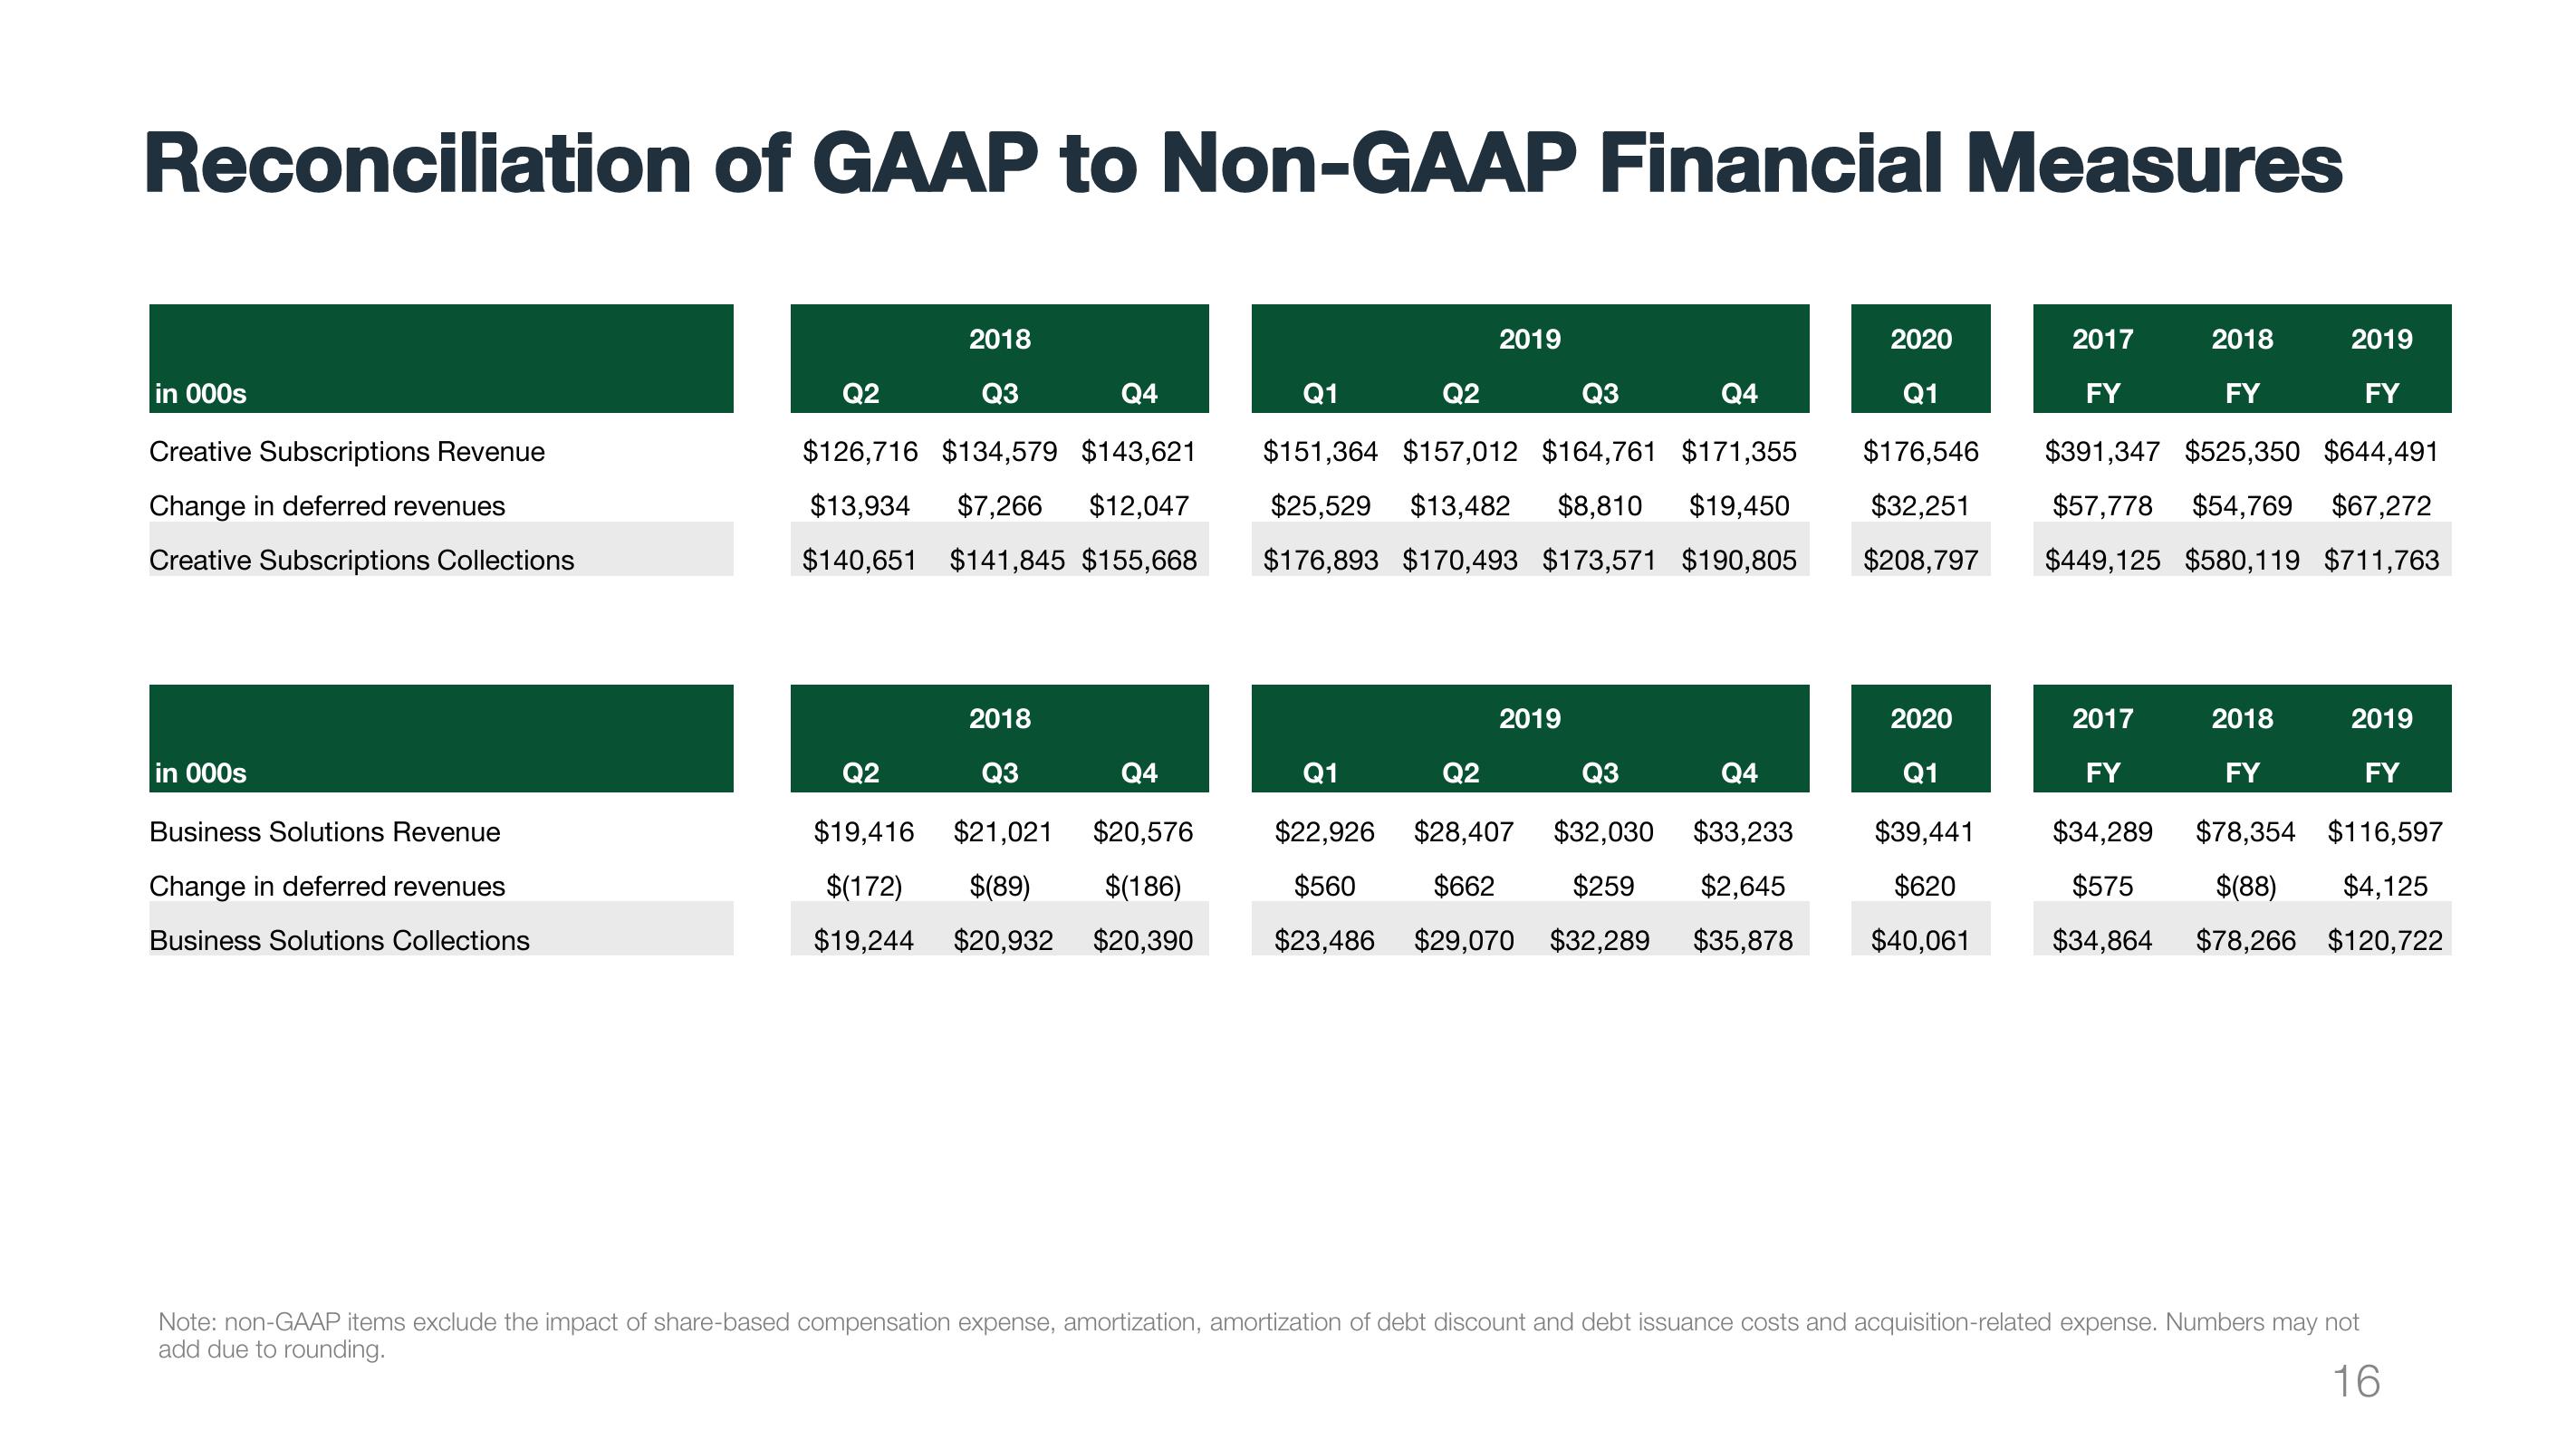
Reconciliation of GAAP to Non-GAAP Financial Measures
in 000s
Creative Subscriptions Revenue
Change in deferred revenues
Creative Subscriptions Collections
in 000s
Business Solutions Revenue
Change in deferred revenues
Business Solutions Collections
2018
Q2
Q4
Q3
$126,716 $134,579 $143,621
$13,934
$140,651
$7,266 $12,047
$141,845 $155,668
2018
Q4
Q2
Q3
$19,416 $21,021 $20,576
$(172) $(89) $(186)
$19,244 $20,932 $20,390
2019
Q4
Q1
Q2
Q3
$151,364 $157,012 $164,761 $171,355
$25,529 $13,482 $8,810 $19,450
$176,893 $170,493 $173,571 $190,805
2019
Q1
Q2
Q3
Q4
$22,926 $28,407 $32,030 $33,233
$560 $662 $259 $2,645
$23,486 $29,070 $32,289 $35,878
2020
Q1
$176,546
$32,251
$208,797
2020
Q1
$39,441
$620
$40,061
2017
2018
2019
FY
FY
FY
$391,347 $525,350 $644,491
$57,778 $54,769 $67,272
$449,125 $580,119 $711,763
2017 2018
2019
FY
FY
FY
$34,289 $78,354 $116,597
$575 $(88) $4,125
$34,864 $78,266 $120,722
1 $3
Note: non-GAAP items exclude the impact of share-based compensation expense, amortization, amortization of debt discount and debt issuance costs and acquisition-related expense. Numbers may not
add due to rounding.
16View entire presentation