Crowdstrike Investor Day Presentation Deck
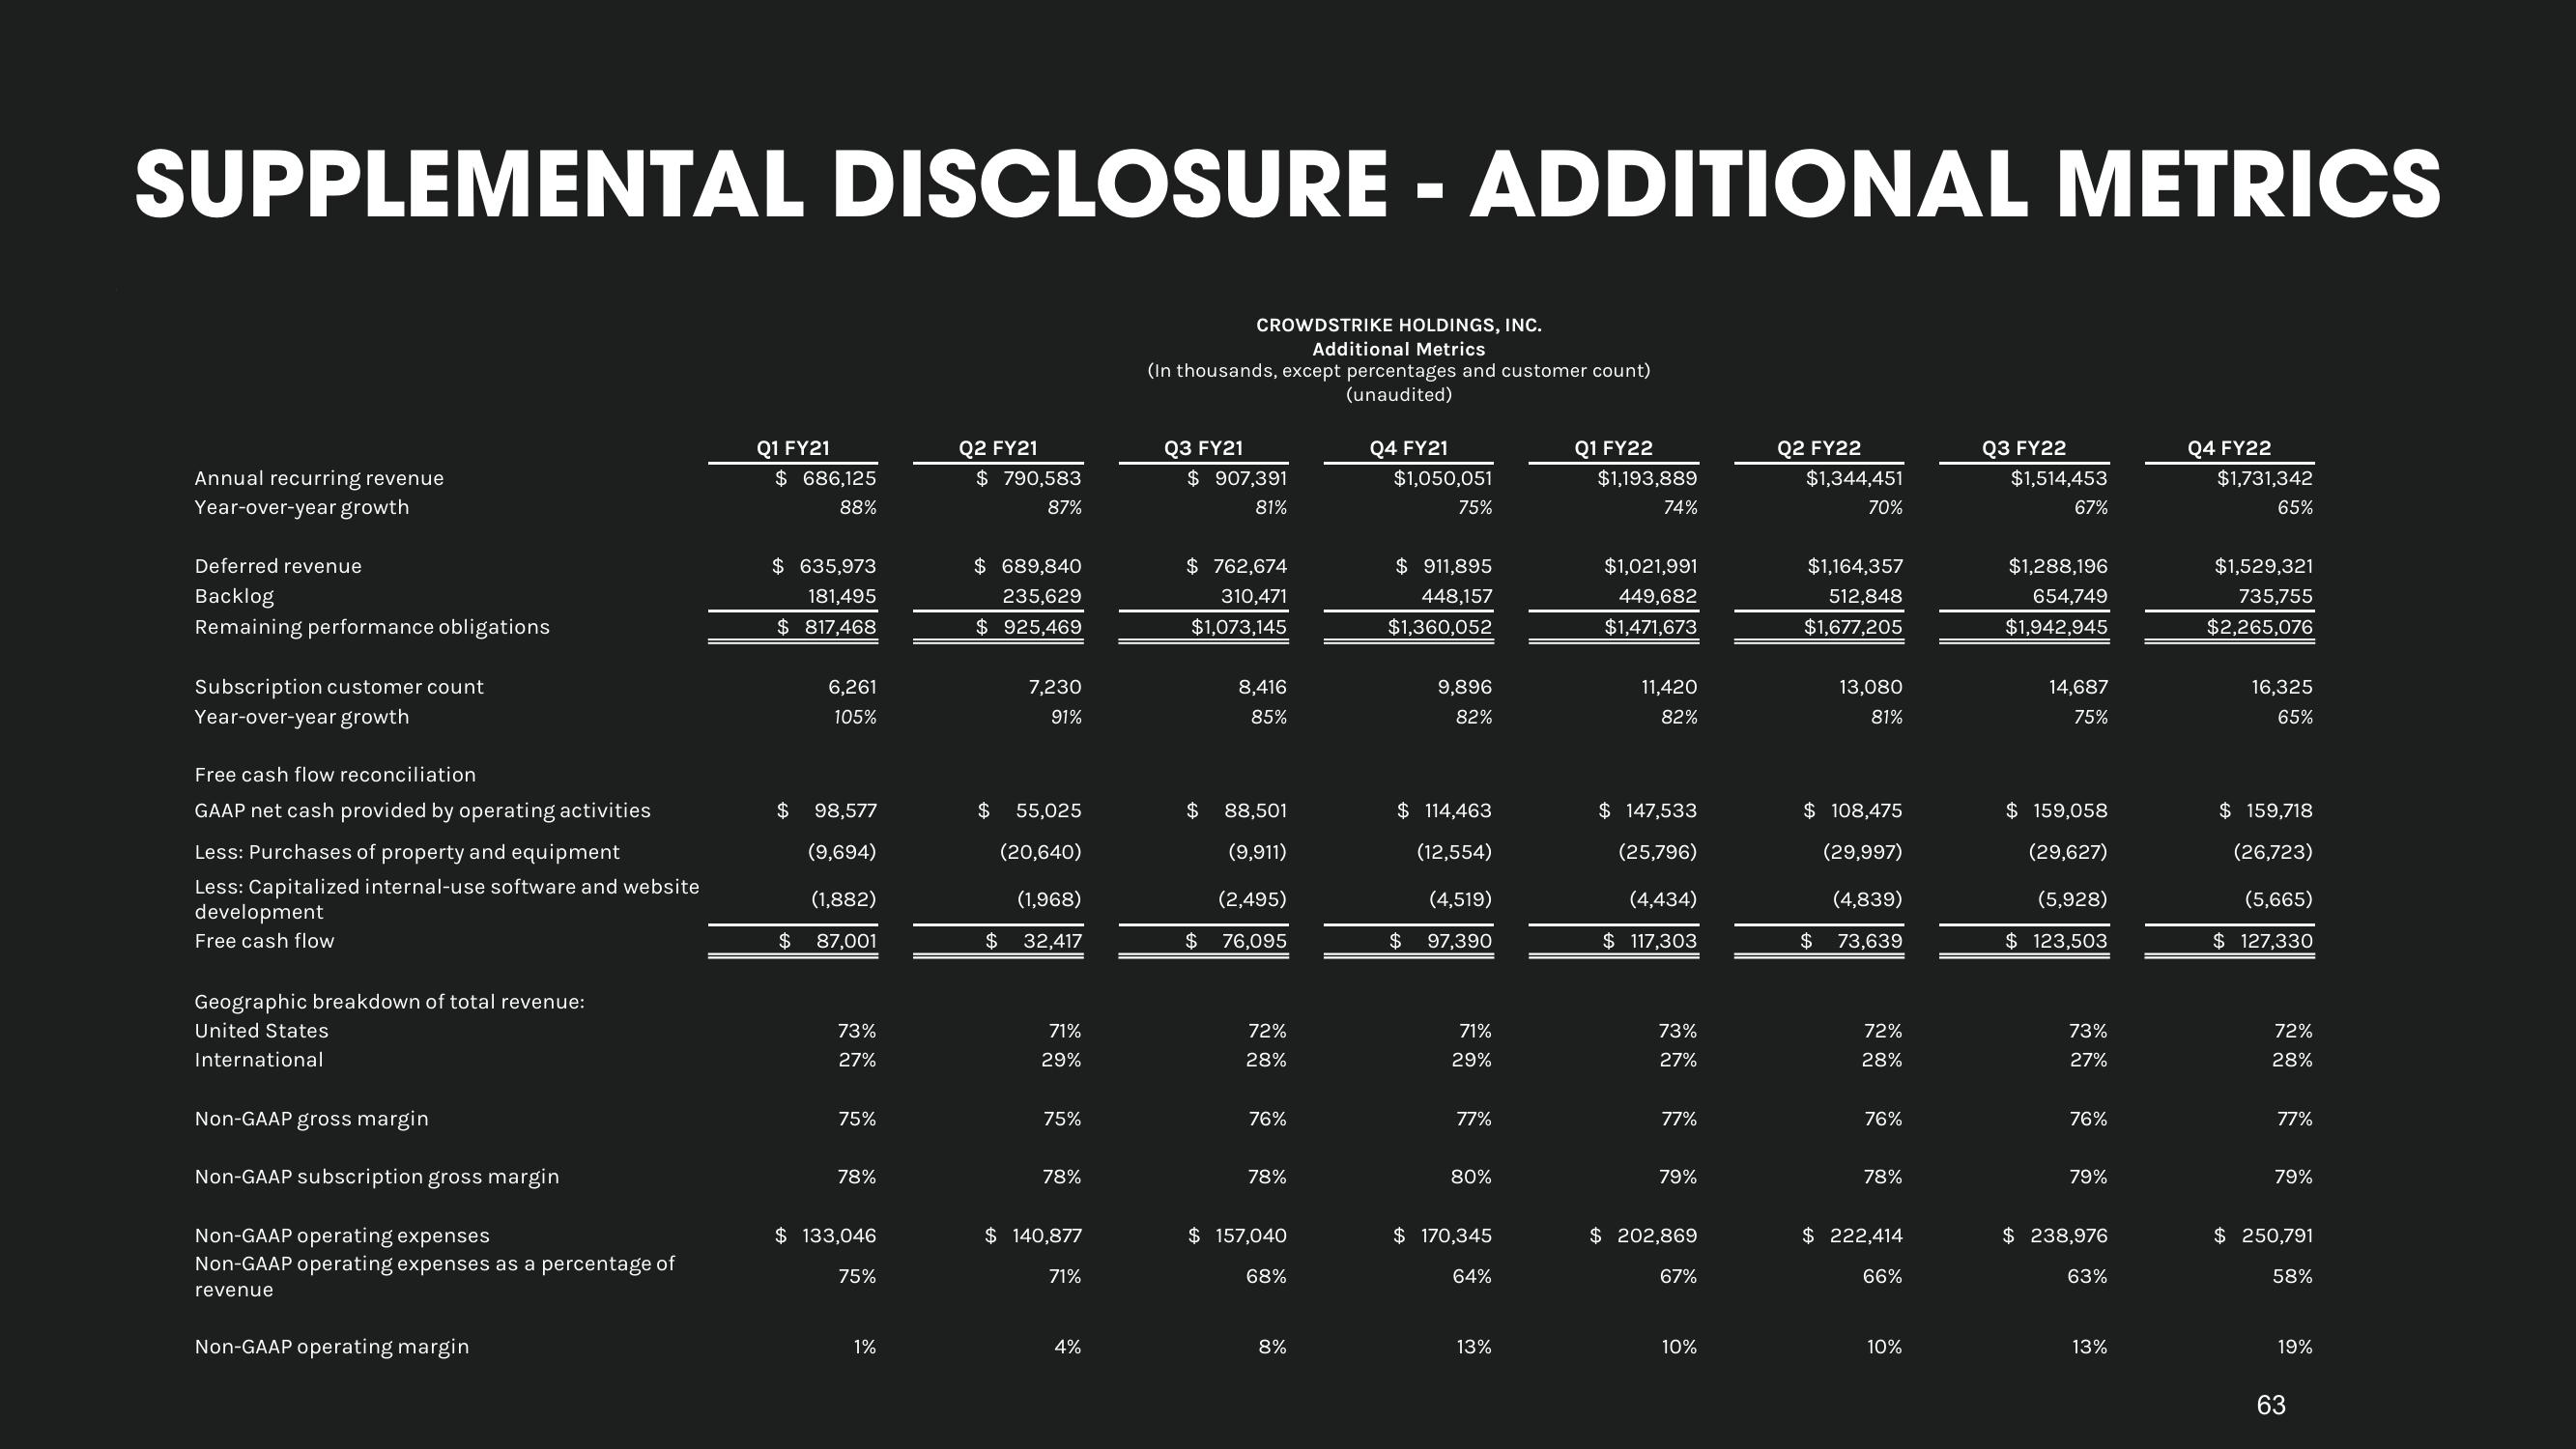
SUPPLEMENTAL DISCLOSURE - ADDITIONAL METRICS
Annual recurring revenue
Year-over-year growth
Deferred revenue
Backlog
Remaining performance obligations
Subscription customer count
Year-over-year growth
Free cash flow reconciliation
GAAP net cash provided by operating activities
Less: Purchases of property and equipment
Less: Capitalized internal-use software and website
development
Free cash flow
Geographic breakdown of total revenue:
United States
International
Non-GAAP gross margin
Non-GAAP subscription gross margin
Non-GAAP operating expenses
Non-GAAP operating expenses as a percentage of
revenue
Non-GAAP operating margin
Q1 FY21
$ 686,125
88%
$ 635,973
181,495
$817,468
6,261
105%
$ 98,577
(9,694)
$
(1,882)
87,001
73%
27%
75%
78%
$ 133,046
75%
1%
Q2 FY21
$ 790,583
87%
$ 689,840
235,629
$925,469
7,230
91%
$ 55,025
(20,640)
$
(1,968)
32,417
71%
29%
75%
78%
$ 140,877
71%
4%
(In thousands, except percentages and customer count)
(unaudited)
Q3 FY21
CROWDSTRIKE HOLDINGS, INC.
Additional Metrics
$ 907,391
81%
$ 762,674
310,471
$1,073,145
$
$
8,416
85%
88,501
(9,911)
(2,495)
76,095
72%
28%
76%
78%
$ 157,040
68%
8%
Q4 FY21
$1,050,051
75%
$ 911,895
448,157
$1,360,052
9,896
82%
$ 114,463
(12,554)
(4,519)
97,390
$
71%
29%
77%
80%
$ 170,345
64%
13%
Q1 FY22
$1,193,889
74%
$1,021,991
449,682
$1,471,673
11,420
82%
$ 147,533
(25,796)
(4,434)
$ 117,303
73%
27%
77%
79%
$ 202,869
67%
10%
Q2 FY22
$1,344,451
70%
$1,164,357
512,848
$1,677,205
13,080
81%
$ 108,475
(29,997)
(4,839)
$ 73,639
72%
28%
76%
78%
$ 222,414
66%
10%
Q3 FY22
$1,514,453
67%
$1,288,196
654,749
$1,942,945
14,687
75%
$ 159,058
(29,627)
(5,928)
$ 123,503
73%
27%
76%
79%
$ 238,976
63%
13%
Q4 FY22
$1,731,342
65%
$1,529,321
735,755
$2,265,076
16,325
65%
$ 159,718
(26,723)
(5,665)
$ 127,330
72%
28%
77%
79%
$ 250,791
58%
19%
63View entire presentation