Alimentation Couche-Tard Investor Presentation
NON-IFRS MEASURES
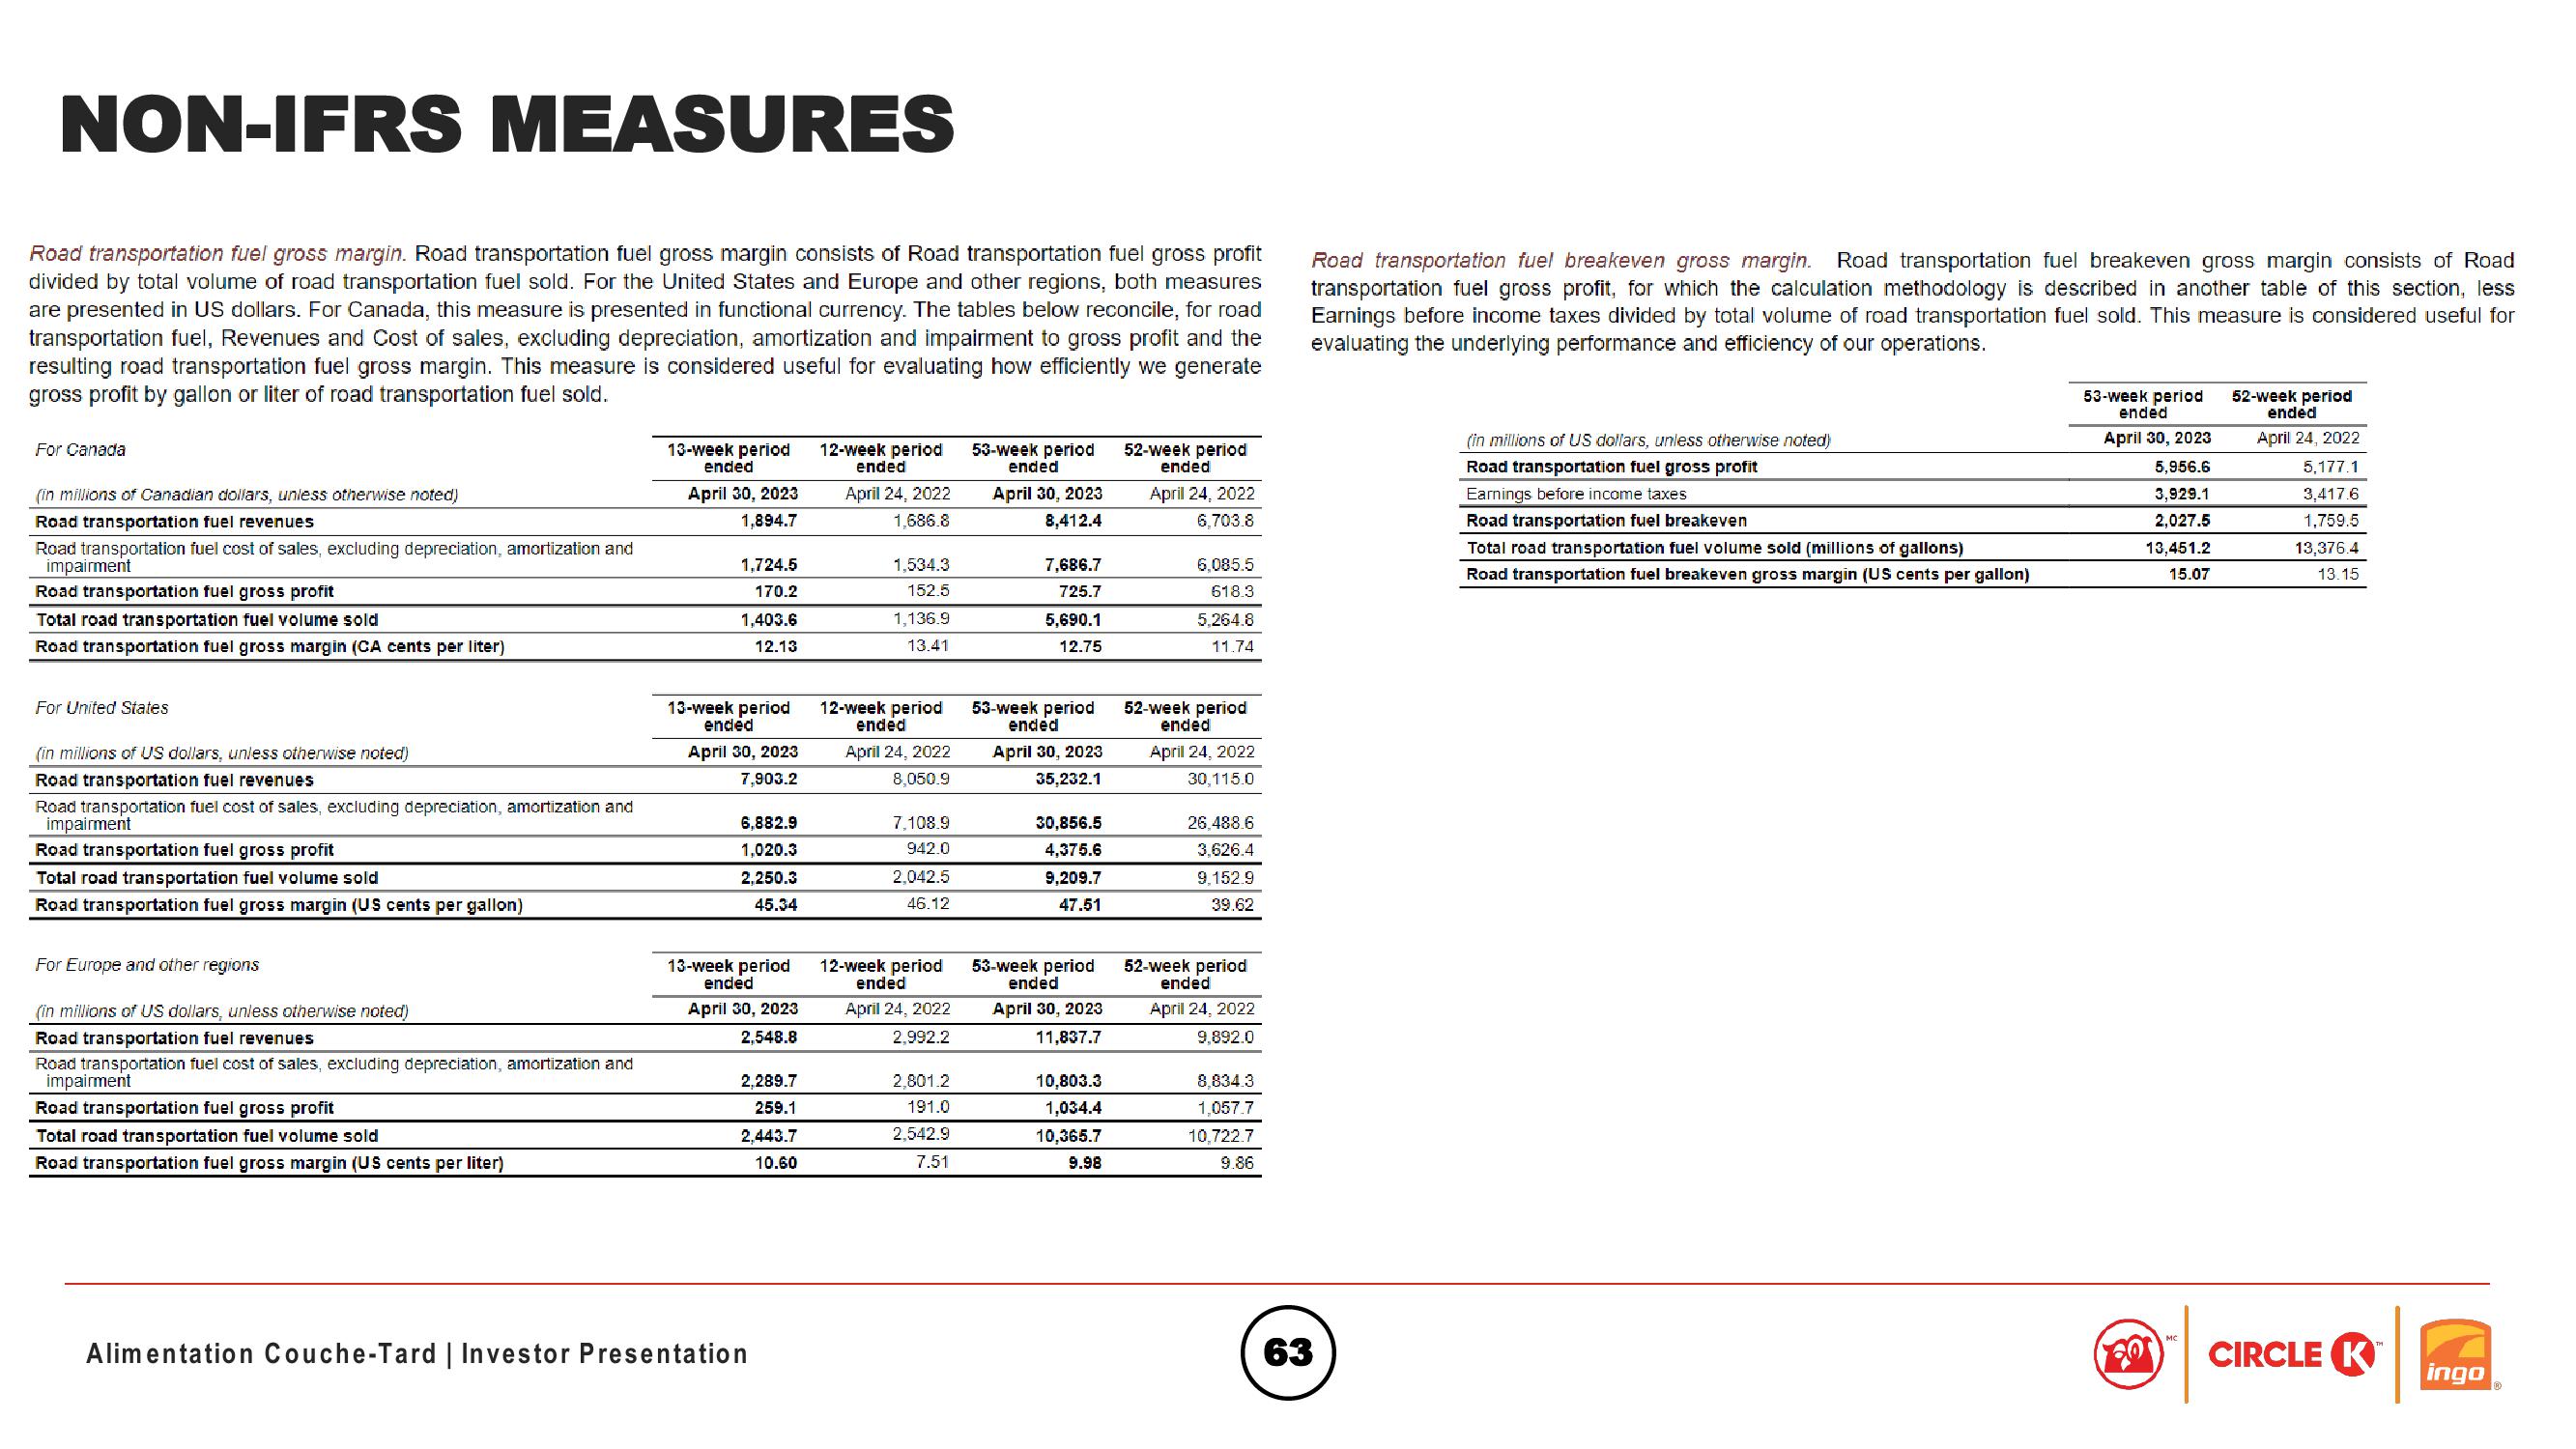
Road transportation fuel gross margin. Road transportation fuel gross margin consists of Road transportation fuel gross profit
divided by total volume of road transportation fuel sold. For the United States and Europe and other regions, both measures
are presented in US dollars. For Canada, this measure is presented in functional currency. The tables below reconcile, for road
transportation fuel, Revenues and Cost of sales, excluding depreciation, amortization and impairment to gross profit and the
resulting road transportation fuel gross margin. This measure is considered useful for evaluating how efficiently we generate
gross profit by gallon or liter of road transportation fuel sold.
For Canada
(in millions of Canadian dollars, unless otherwise noted)
Road transportation fuel revenues
Road transportation fuel cost of sales, excluding depreciation, amortization and
impairment
Road transportation fuel gross profit
Total road transportation fuel volume sold
Road transportation fuel gross margin (CA cents per liter)
April 30, 2023
52-week period
ended
Road transportation fuel breakeven gross margin. Road transportation fuel breakeven gross margin consists of Road
transportation fuel gross profit, for which the calculation methodology is described in another table of this section, less
Earnings before income taxes divided by total volume of road transportation fuel sold. This measure is considered useful for
evaluating the underlying performance and efficiency of our operations.
(in millions of US dollars, unless otherwise noted)
Road transportation fuel gross profit
Earnings before income taxes
Total road transportation fuel volume sold (millions of gallons)
Road transportation fuel breakeven gross margin (US cents per gallon)
13-week period
ended
1,894.7
12-week period
ended
April 24, 2022
1,686.8
53-week period
ended
April 30, 2023
8,412.4
April 24, 2022
6,703.8
Road transportation fuel breakeven
1,724.5
1,534.3
7,686.7
6,085.5
170.2
152.5
1.403.6
12.13
1,136.9
13.41
725.7
5,690.1
12.75
618.3
5.264.8
11.74
53-week period
ended
April 30, 2023
52-week period
ended
April 24, 2022
5,956.6
5,177.1
3,929.1
3,417.6
2.027.5
1.759.5
13,451.2
13,376.4
15.07
13.15
For United States
(in millions of US dollars, unless otherwise noted)
Road transportation fuel revenues
Road transportation fuel cost of sales, excluding depreciation, amortization and
impairment
Road transportation fuel gross profit
Total road transportation fuel volume sold
Road transportation fuel gross margin (US cents per gallon)
For Europe and other regions
(in millions of US dollars, unless otherwise noted)
Road transportation fuel revenues
Road transportation fuel cost of sales, excluding depreciation, amortization and
impairment
Road transportation fuel gross profit
Total road transportation fuel volume sold
Road transportation fuel gross margin (US cents per liter)
13-week period
ended
12-week period
53-week period
ended
ended
April 30, 2023
7,903.2
April 24, 2022
8,050.9
April 30, 2023
35,232.1
52-week period
ended
April 24, 2022
30,115.0
6,882.9
7,108.9
30,856.5
26,488.6
1,020.3
2,250.3
942.0
2,042.5
4,375.6
3,626.4
45.34
46.12
9,209.7
47.51
9,152.9
39.62
13-week period
ended
12-week period
ended
April 30, 2023
April 24, 2022
April 30, 2023
2,548.8
2,992.2
11,837.7
53-week period
ended
52-week period
ended
April 24, 2022
9,892.0
2,289.7
259.1
2,801.2
10,803.3
8,834.3
2,443.7
191.0
2,542.9
1,034.4
10,365.7
1,057.7
10,722.7
10.60
7.51
9.98
9.86
Alimentation Couche-Tard | Investor Presentation
63
3
CIRCLE K
ingoView entire presentation