Lyft Results Presentation Deck
Key Highlights Q2'21
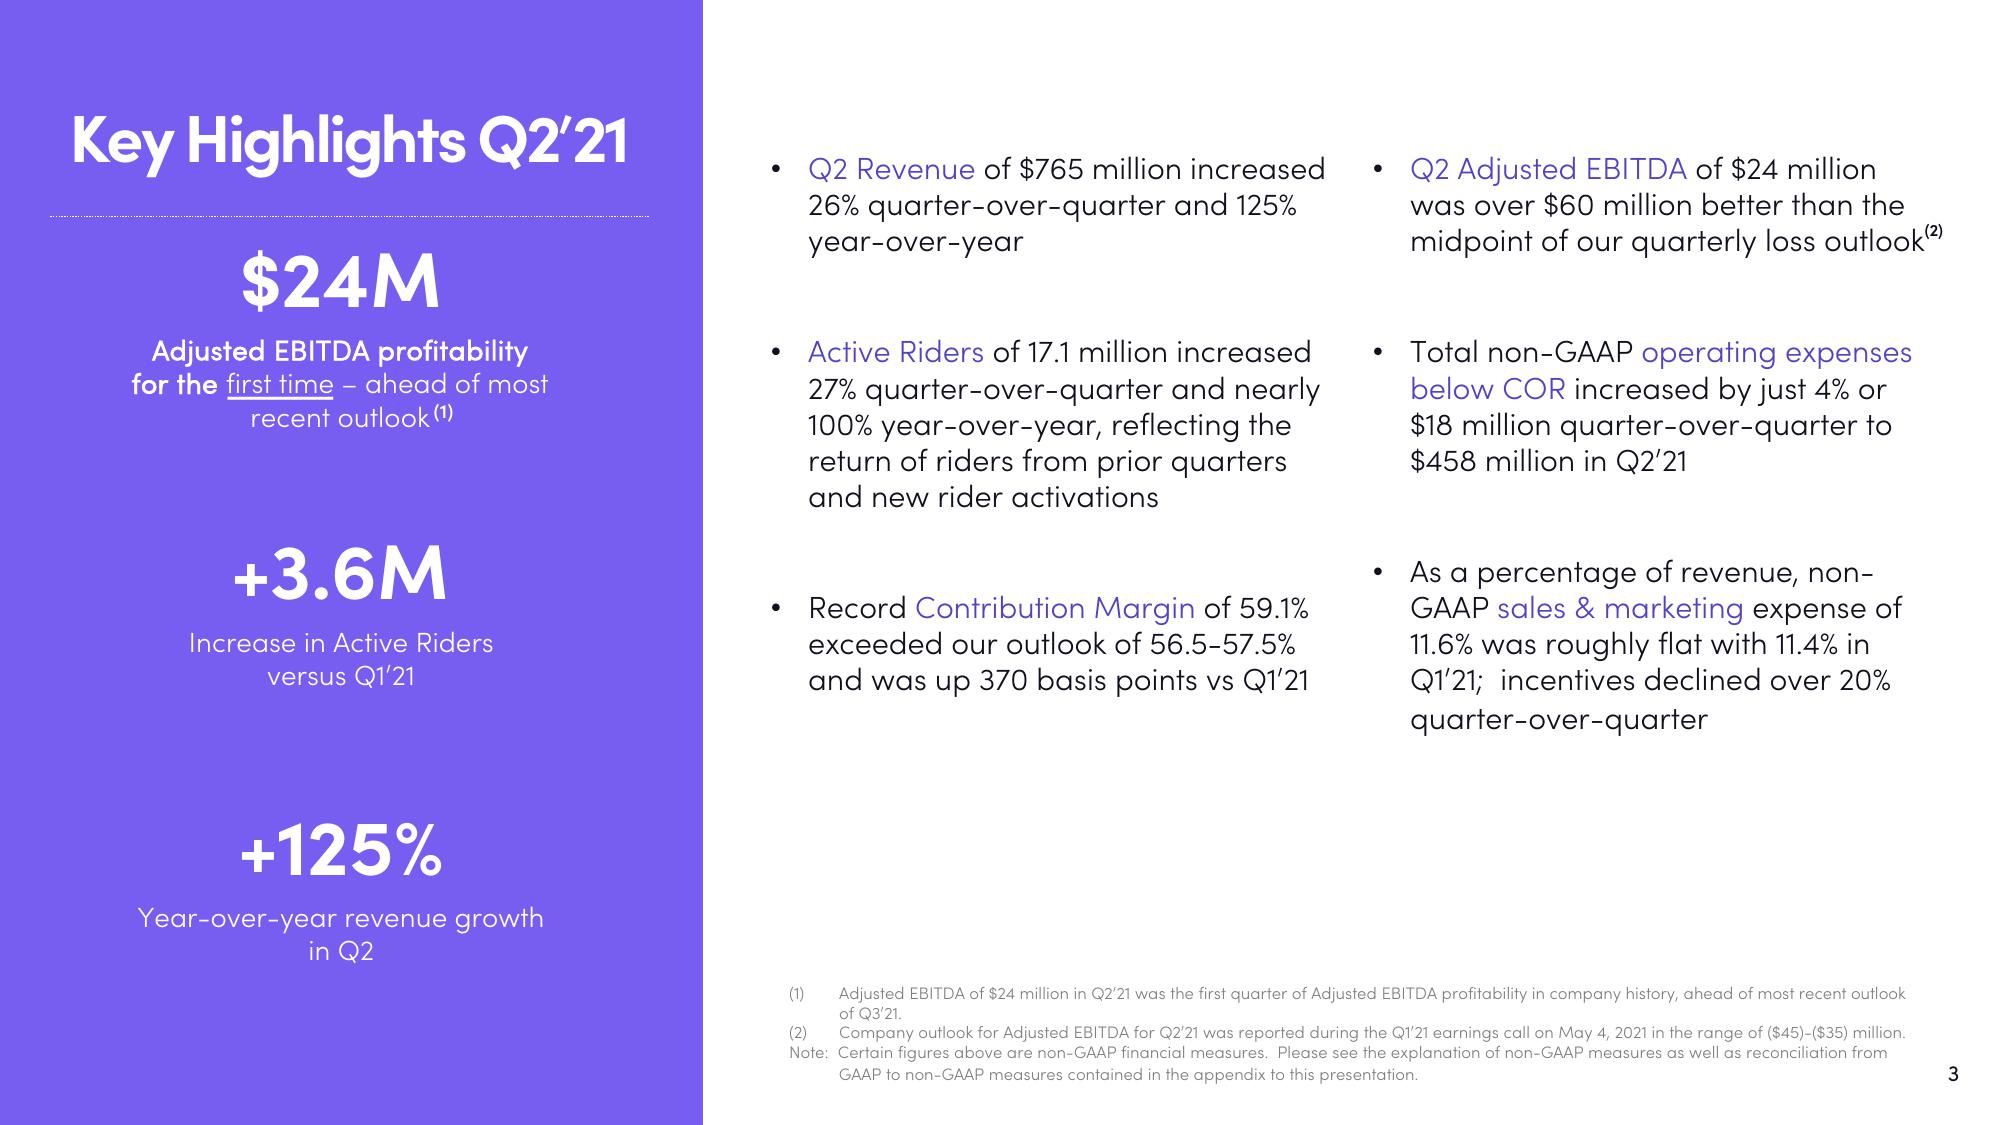
$24M
Adjusted EBITDA profitability
for the first time - ahead of most
recent outlook (1)
+3.6M
Increase in Active Riders
versus Q1'21
+125%
Year-over-year revenue growth
in Q2
●
●
Q2 Revenue of $765 million increased
26% quarter-over-quarter and 125%
year-over-year
Active Riders of 17.1 million increased
27% quarter-over-quarter and nearly
100% year-over-year, reflecting the
return of riders from prior quarters
and new rider activations
Record Contribution Margin of 59.1%
exceeded our outlook of 56.5-57.5%
and was up 370 basis points vs Q1'21
●
●
Q2 Adjusted EBITDA of $24 million
was over $60 million better than the
midpoint of our quarterly loss outlook(²)
Total non-GAAP operating expenses
below COR increased by just 4% or
$18 million quarter-over-quarter to
$458 million in Q2'21
As a percentage of revenue, non-
GAAP sales & marketing expense of
11.6% was roughly flat with 11.4% in
Q1'21; incentives declined over 20%
quarter-over-quarter
(1)
Adjusted EBITDA of $24 million in Q2'21 was the first quarter of Adjusted EBITDA profitability in company history, ahead of most recent outlook
of Q3'21.
(2) Company outlook for Adjusted EBITDA for Q2'21 was reported during the Q1'21 earnings call on May 4, 2021 in the range of ($45)-($35) million.
Note: Certain figures above are non-GAAP financial measures. Please see the explanation of non-GAAP measures as well as reconciliation from
GAAP to non-GAAP measures contained in the appendix to this presentation.
3View entire presentation