Fresnillo Results Presentation Deck
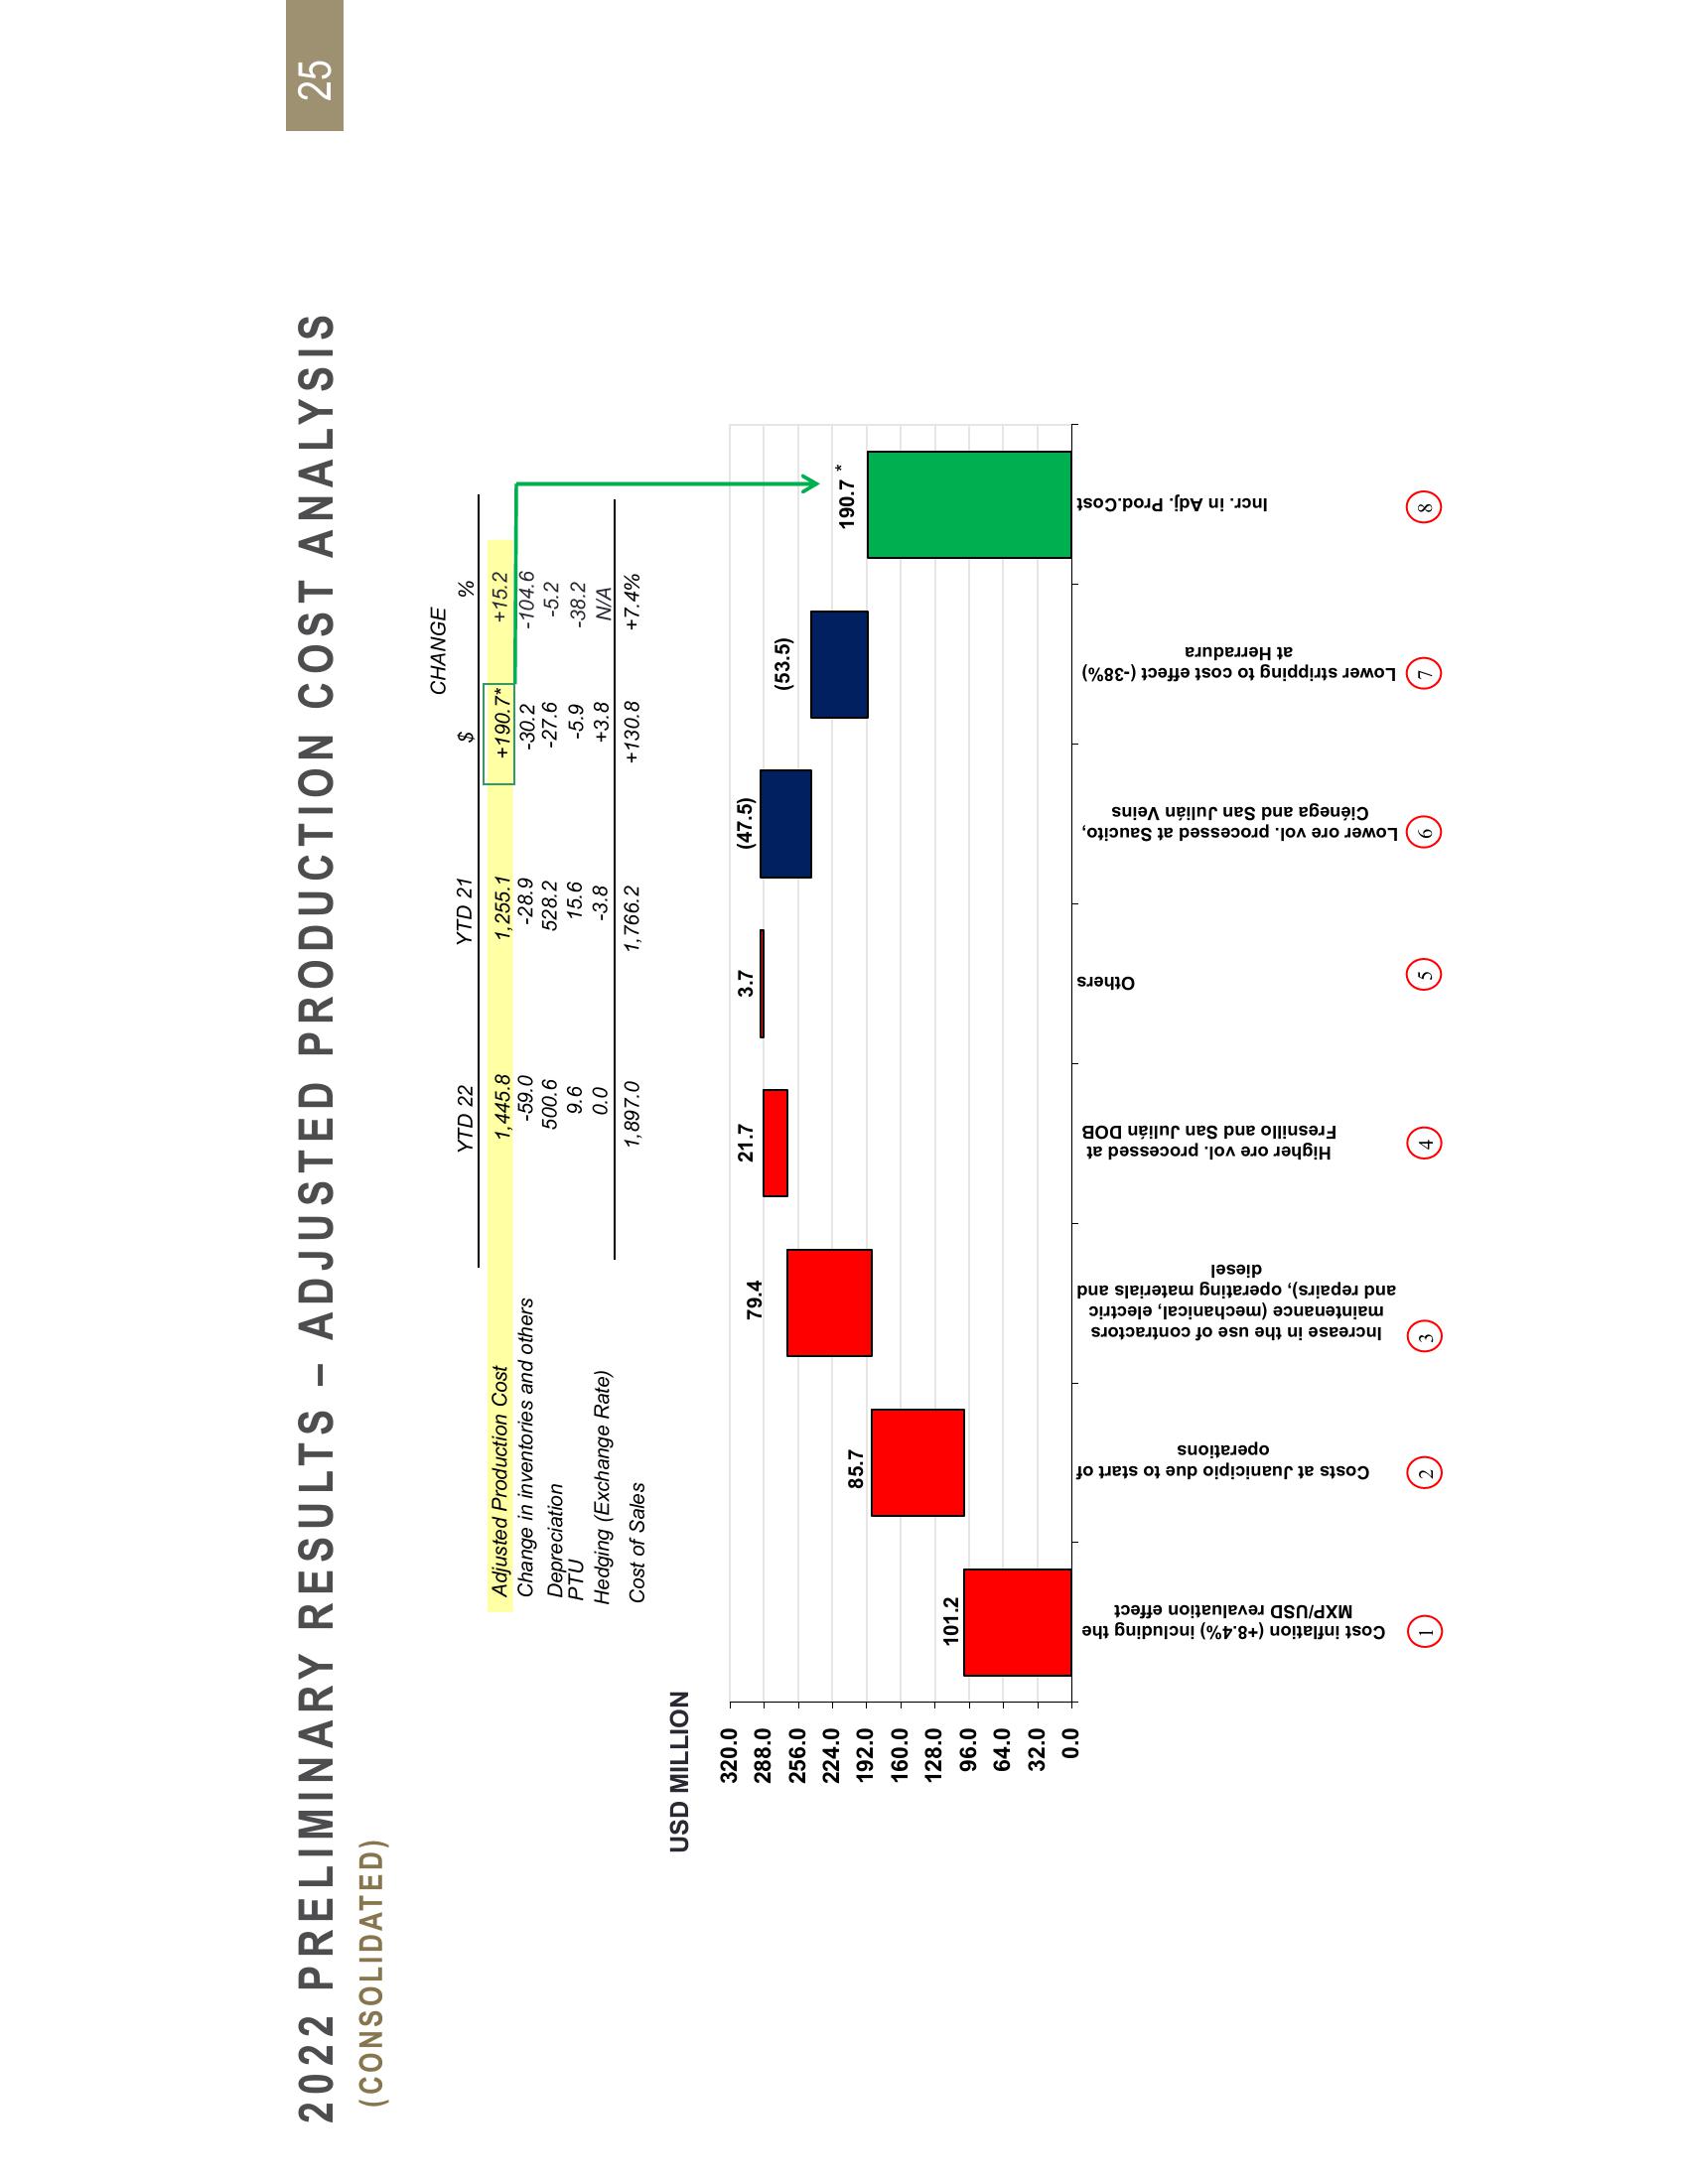
2022 PRELIMINARY RESULTS ADJUSTED PRODUCTION COST ANALYSIS
(CONSOLIDATED)
USD MILLION
320.0
288.0
256.0
224.0
192.0
160.0
128.0
96.0
64.0
32.0
0.0
MXP/USD (84%) including the
revaluation effect
Adjusted Production Cost
Change in inventories and others
Depreciation
101.2
Cost inflation
PTU
Hedging (Exchange Rate)
Cost of Sales
85.7
Costs at Juanicipio due to start of
operations
79.4
Increase in the use of contractors
maintenance (mechanical, electric
and repairs), operating materials and
diesel
YTD 22
1,445.8
-59.0
500.6
9.6
0.0
1,897.0
21.7
Higher ore vol. processed at
Fresnillo and San Julián DOB
4
3.7
Others
YTD 21
1,255.1
-28.9
528.2
15.6
-3.8
1,766.2
(47.5)
Lower ore vol. processed at Saucito,
Ciénega and San Julián Veins
CHANGE
$
+190.7*
-30.2
-27.6
-5.9
+3.8
+130.8
(53.5)
(Lower stripping to cost effect (-38%)
at Herradura
%
+15.2
-104.6
-5.2
-38.2
N/A
+7.4%
190.7
Incr. in Adj. Prod.Cost
*
25View entire presentation