Comcast Results Presentation Deck
Sky 1st Quarter 2021 Overview
7
Customer Relationships
23.2
+1%
1Q20
Revenue
$4,517
1Q20
23.0
(1%)
2Q20
+2.0%
$4,997
1Q21
23.0
(1%)
3Q20
23.2
4Q20
$551
0%
1Q20
23.4
All percentages represent year/year constant currency growth rates.
See Notes on Slide 11
+1%
($M) Adjusted EBITDA ($M)
1Q21
(39.6%)
$364
(M)
1Q21
Commentary
●
●
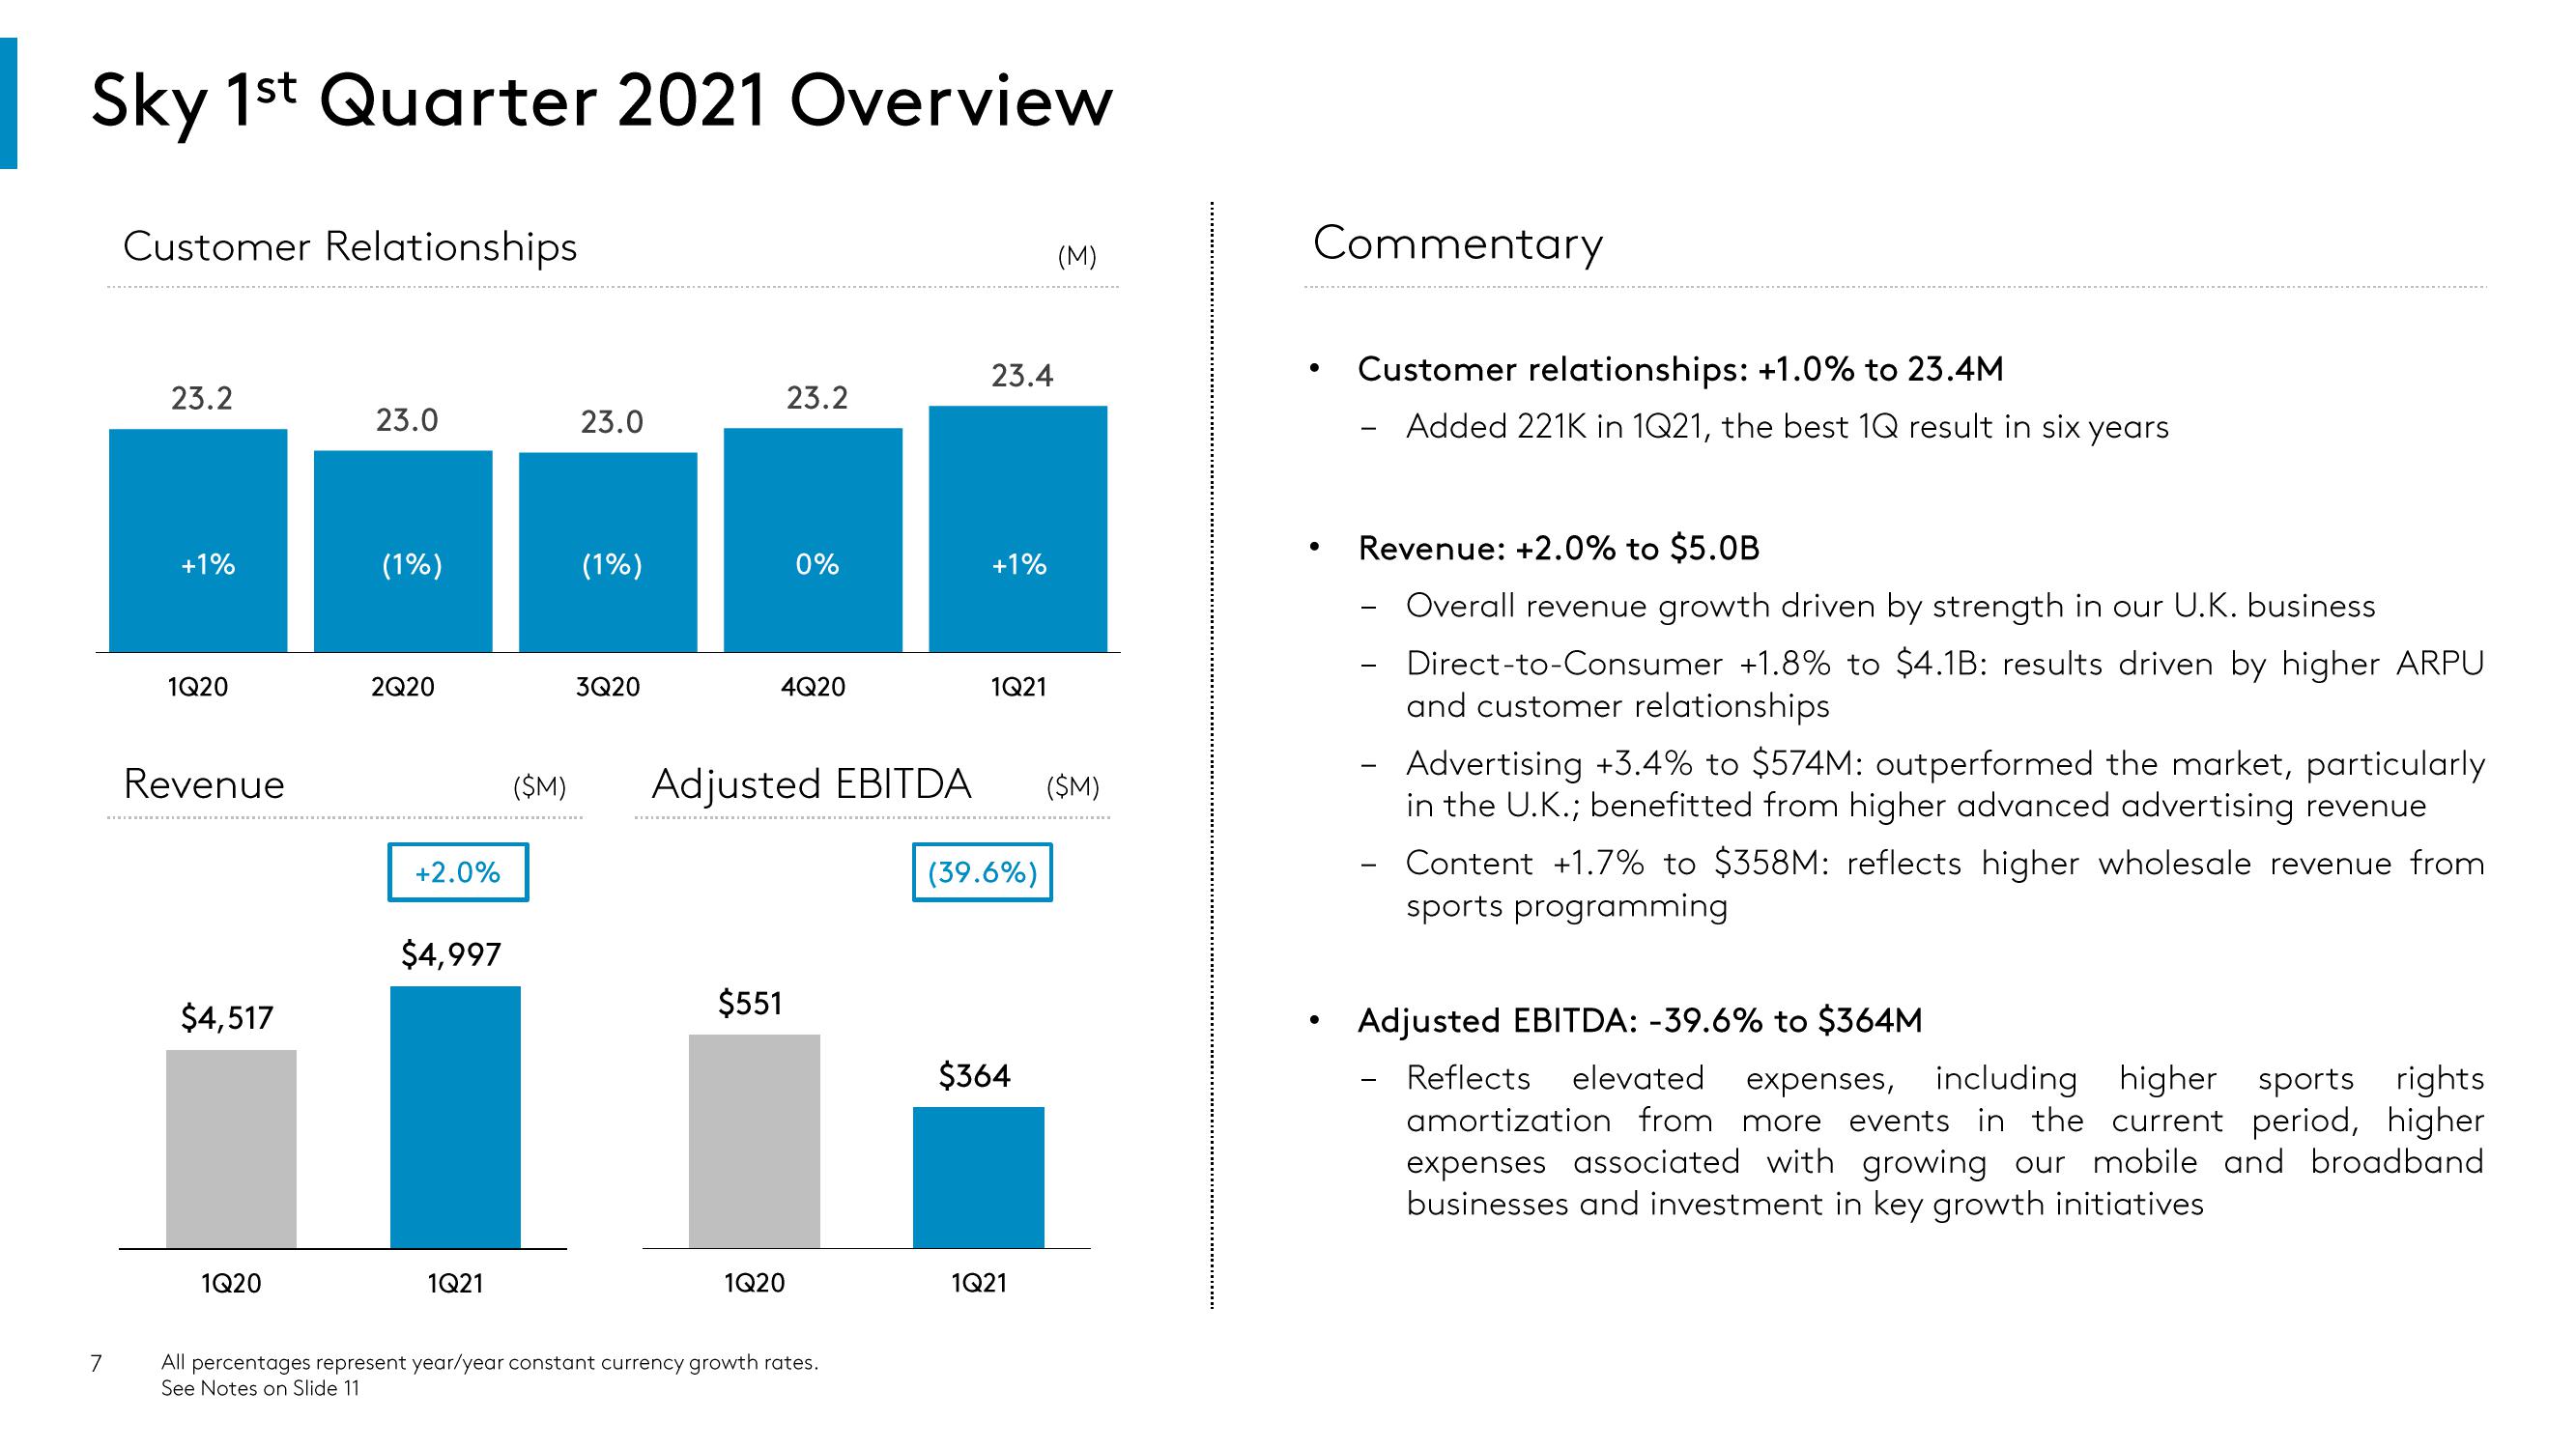
Customer relationships: +1.0% to 23.4M
Added 221K in 1Q21, the best 1Q result in six years
-
Revenue: +2.0% to $5.0B
Overall revenue growth driven by strength in our U.K. business
Direct-to-Consumer +1.8% to $4.1B: results driven by higher ARPU
and customer relationships
Advertising +3.4% to $574M : outperformed the market, particularly
in the U.K.; benefitted from higher advanced advertising revenue
Content +1.7% to $358M: reflects higher wholesale revenue from
sports programming
Adjusted EBITDA: -39.6% to $364M
Reflects elevated expenses, including higher sports rights
amortization from more events in the current period, higher
expenses associated with growing our mobile and broadband
businesses and investment in key growth initiativesView entire presentation