Fourth Quarter and Fiscal Year 2023 Financial Results
15
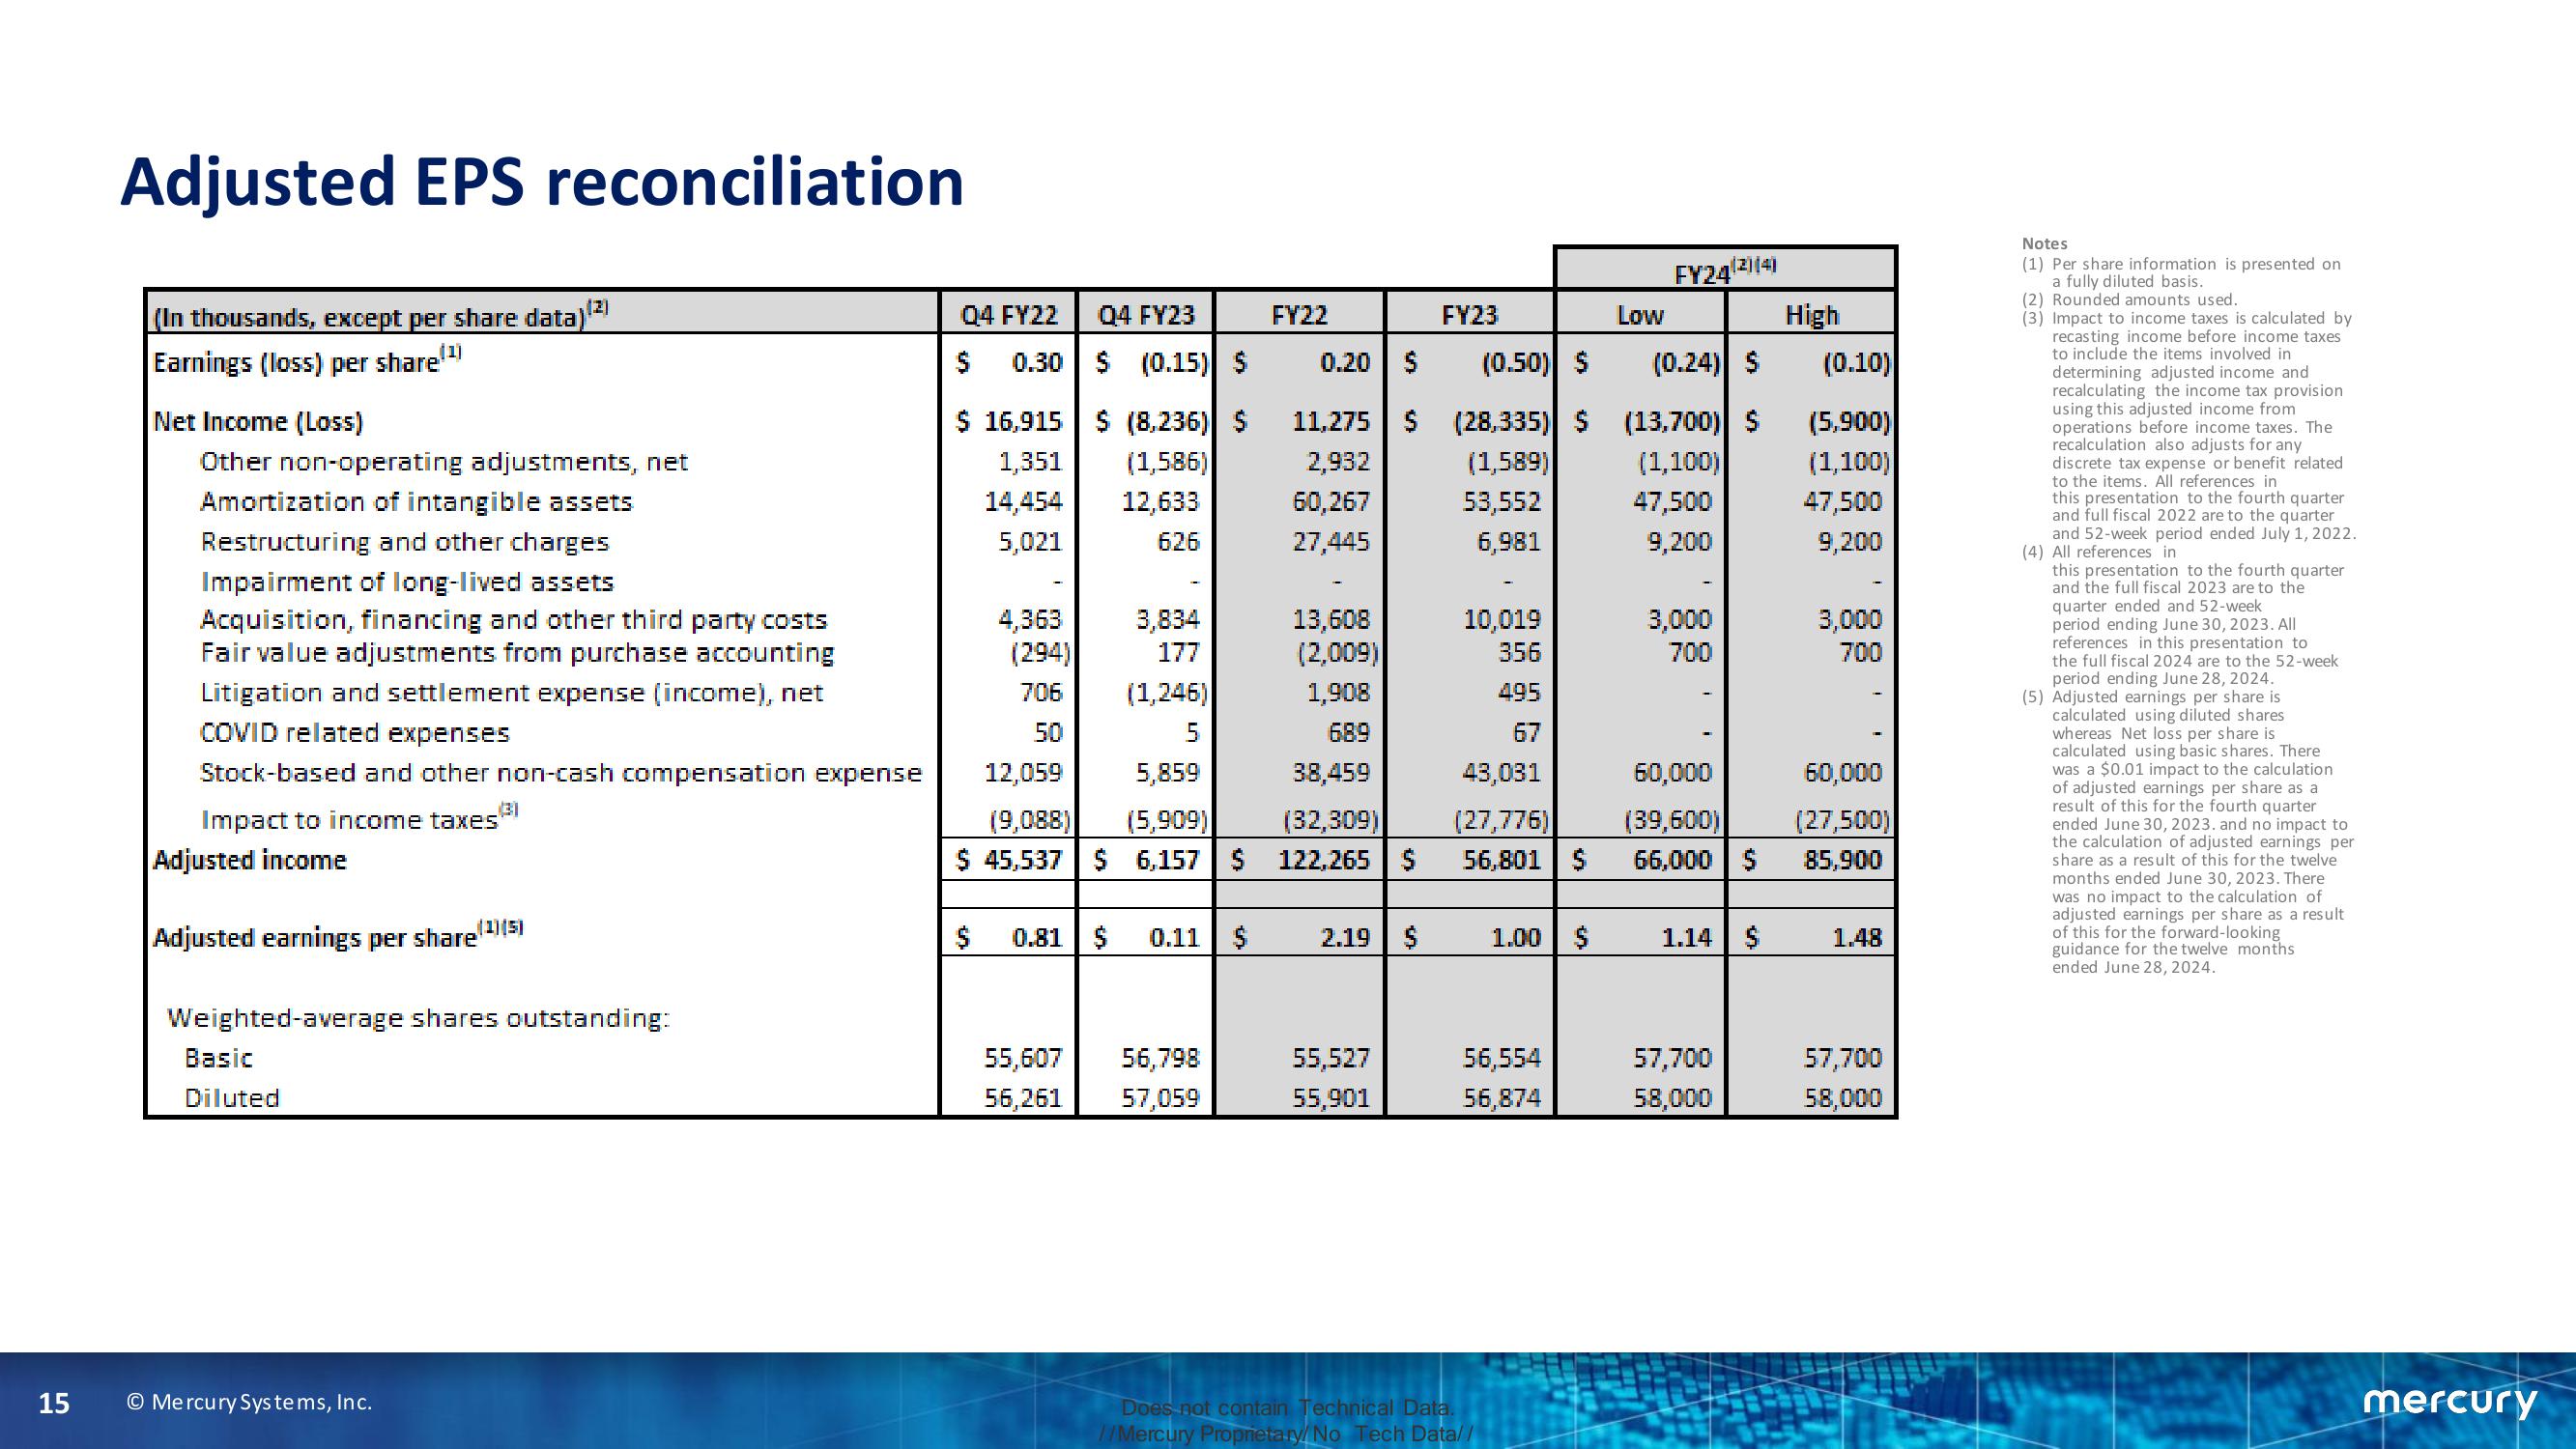
Adjusted EPS reconciliation
(In thousands, except per share data)
Earnings (loss) per share!¹¹)
Net Income (Loss)
Other non-operating adjustments, net
Amortization of intangible assets
Restructuring and other charges
Impairment of long-lived assets
Acquisition, financing and other third party costs
Fair value adjustments from purchase accounting
Litigation and settlement expense (income), net
COVID related expenses
Stock-based and other non-cash compensation expense
Impact to income taxes"
Adjusted income
Adjusted earnings per share
(1)(5)
Weighted-average shares outstanding:
Basic
Diluted
© Mercury Systems, Inc.
Q4 FY22
$ 0.30
$ 16,915
$ (8,236) $
1,351
(1,586)
14,454 12,633
5,021
626
04 FY23
$ (0.15) $
4,363
(294)
706
50
$ 0.81 $ 0.11 $
FY22
3,834
13,608
(2,009)
1,908
177
(1,246)
5
5,859
(9,088) (5,909)
689
12,059
38,459
(32,309)
$ 45,537 $ 6,157 $ 122,265 $
55,607 56,798
56,261
57,059
0.20 $
11,275 $
2,932
60,267
27,445
2.19 $
55,527
55,901
FY23
10,019
356
495
67
43,031
(27,776)
56,801 $
(0.50) $ (0.24) $
(0.10)
(28,335) $ (13,700) $ (5,900)
(1,589)
(1,100)
(1,100)
53,552
47,500
47,500
6,981
9,200
9,200
1.00 $
56,554
56,874
Does not contain Technical Data.
//Mercury Proprietary/No Tech Data//
Low
FY24
(2)(4)
3,000
700
60,000
(39,600)
66,000 $
1.14 $
57,700
58,000
High
3,000
700
60,000
(27,500)
85,900
1.48
57,700
58,000
Notes
(1) Per share information is presented on
a fully diluted basis.
(2) Rounded amounts used.
(3) Impact to income taxes is calculated by
recasting income before income taxes
to include the items involved in
determining adjusted income and
recalculating the income tax provision
using this adjusted income from
operations before income taxes. The
recalculation also adjusts for any
discrete tax expense or benefit related
to the items. All references in
this presentation to the fourth quarter
and full fiscal 2022 are to the quarter
and 52-week period ended July 1, 2022.
(4) All references in
this presentation to the fourth quarter
and the full fiscal 2023 are to the
quarter ended and 52-week
period ending June 30, 2023. All
references in this presentation to
the full fiscal 2024 are to the 52-week
period ending June 28, 2024.
(5) Adjusted earnings per share is
calculated using diluted shares
whereas Net loss per share is
calculated using basic shares. There
was a $0.01 impact to the calculation
of adjusted earnings per share as a
result of this for the fourth quarter
ended June 30, 2023. and no impact to
the calculation of adjusted earnings per
share as a result of this for the twelve
months ended June 30, 2023. There
was no impact to the calculation of
adjusted earnings per share as a result
of this for the forward-looking
guidance for the twelve months
ended June 28, 2024.
mercuryView entire presentation