Palantir IPO Presentation Deck
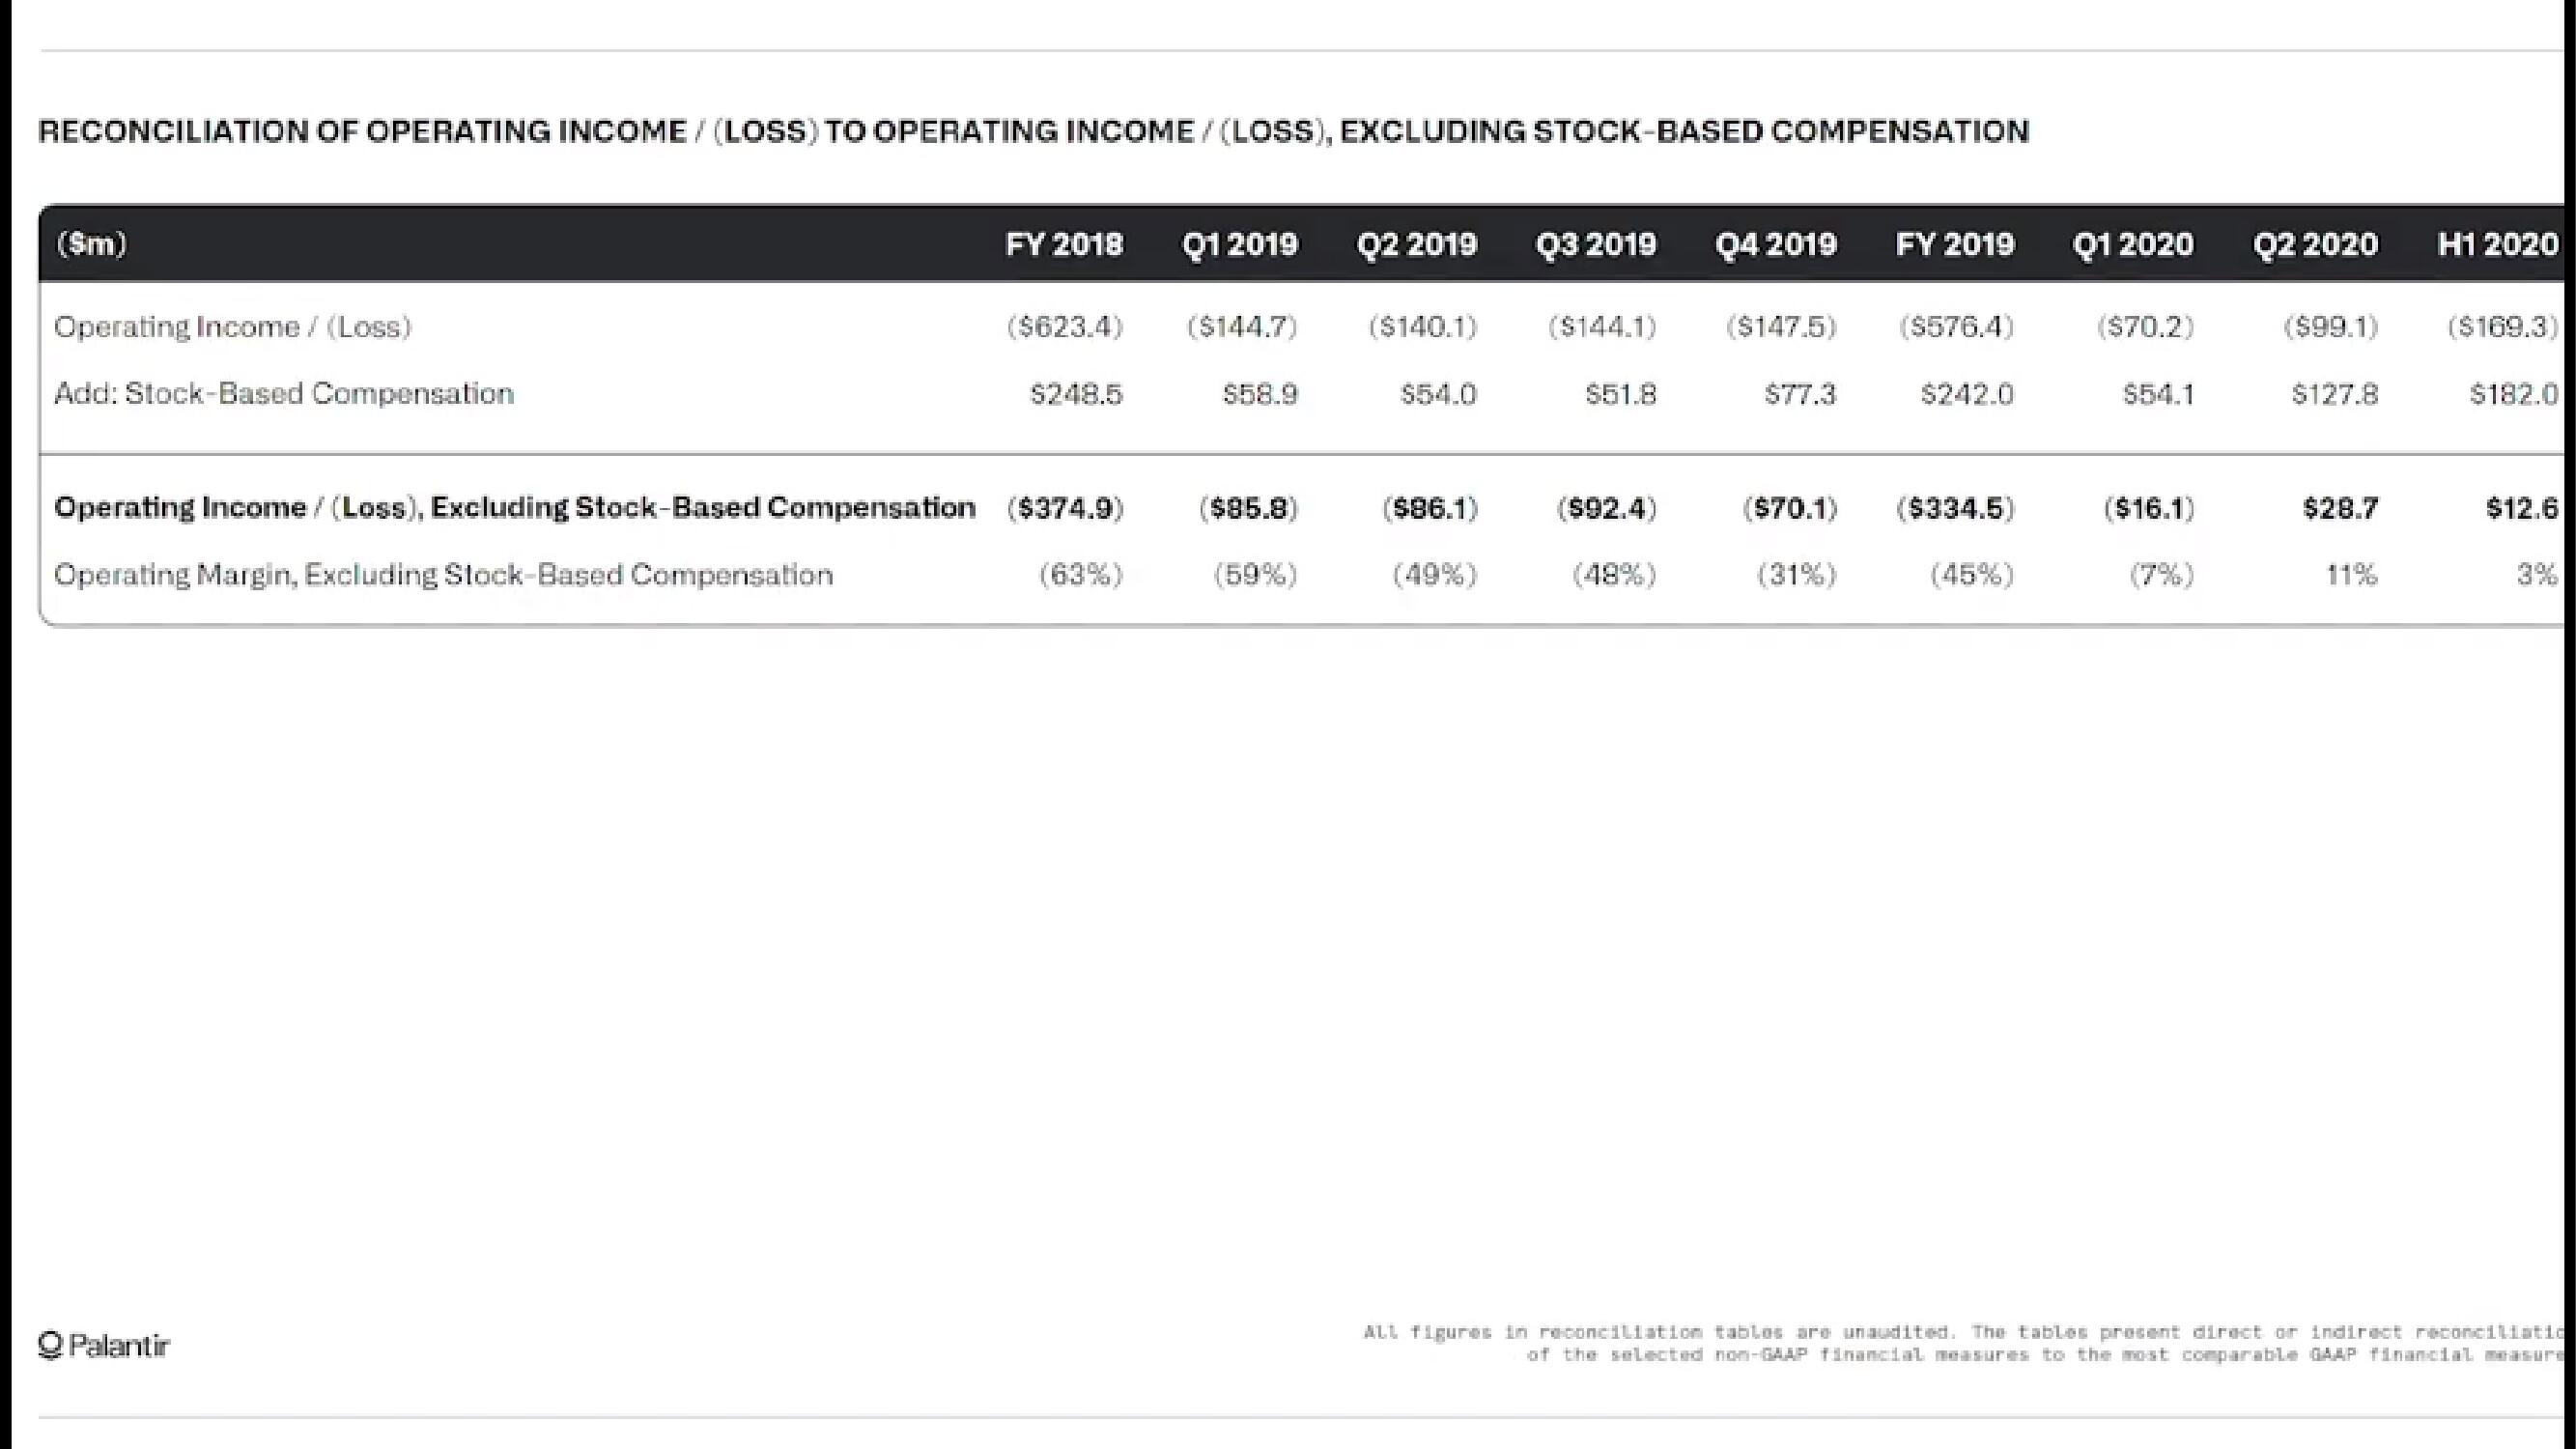
RECONCILIATION OF OPERATING INCOME / (LOSS) TO OPERATING INCOME /(LOSS), EXCLUDING STOCK-BASED COMPENSATION
($m)
Operating Income / (Loss)
Add: Stock-Based Compensation
FY 2018
Q Palantir
($623.4)
$248.5
Operating Income / (Loss), Excluding Stock-Based Compensation ($374.9)
Operating Margin, Excluding Stock-Based Compensation
(63%)
Q1 2019 Q2 2019
($144.7)
$58.9
($85.8)
(59%)
($140.1)
$54.0
($86.1)
(49%)
Q3 2019
$51.8
Q4 2019
($144.1) ($147.5) ($576.4)
($92.4)
(48%)
FY 2019
$77.3
$242.0
($70.1) ($334.5)
(31%)
(45%)
Q1 2020
($70.2)
$54.1
($16.1)
Q2 2020
($99.1)
$127.8
$28.7
11%
H100
($169.3)
$182.0
$12.6
ALL figures in reconciliation tables are unaudited. The tables present direct or indirect reconciliatic
of the selected non-GAAP financial measures to the most comparable GAAP financial measureView entire presentation