BlackRock Results Presentation Deck
Equity Indices
Domestic
S&P 500
Global
MSCI Barra World Index
MSCI Europe Index
MSCI AC Asia Pacific Index
MSCI Emerging Markets Index
S&P Global Natural Resources
BLK Equity Index(1)
Fixed Income Index
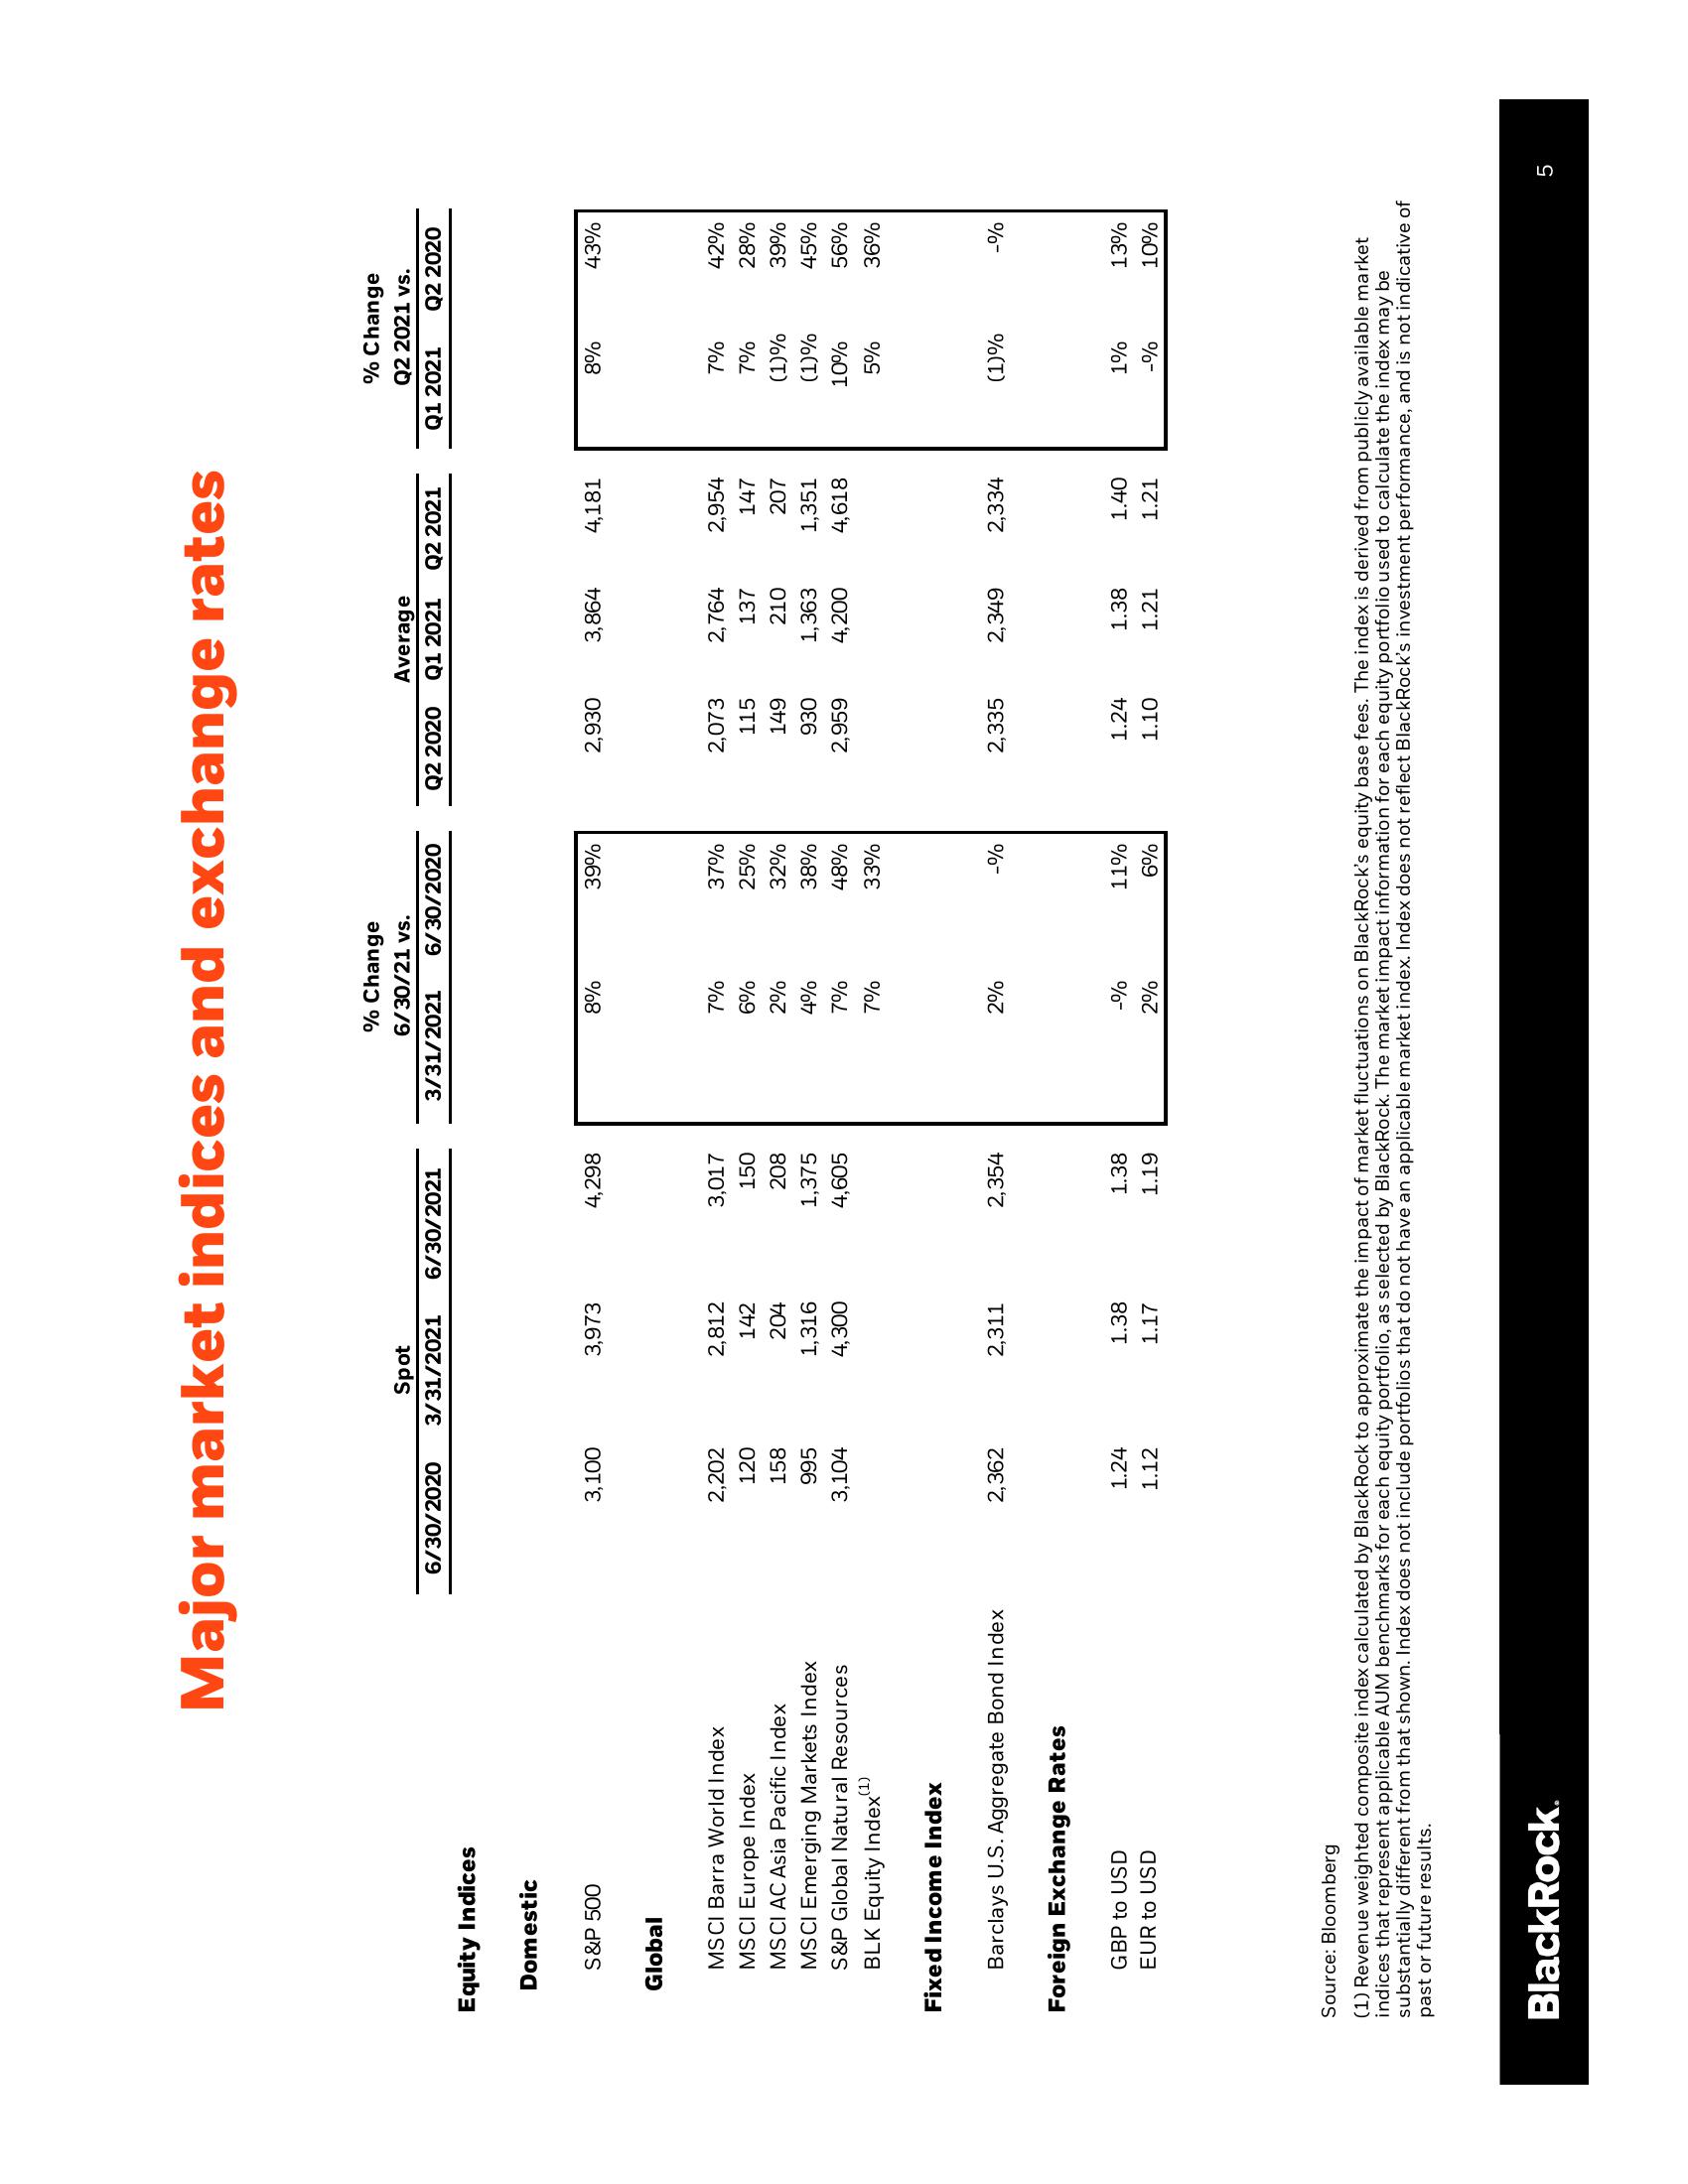
Major market indices and exchange rates
Barclays U.S. Aggregate Bond Index
Foreign Exchange Rates
GBP to USD
EUR to USD
BlackRock.
Spot
6/30/2020 3/31/2021
3,100
2,202
120
158
995
3,104
2,362
1.24
1.12
3,973
2,812
142
204
1,316
4,300
2,311
1.38
1.17
6/30/2021
4,298
3,017
150
208
1,375
4,605
2,354
1.38
1.19
% Change
6/30/21 vs.
3/31/2021 6/30/2020
8%
7%
6%
2%
4%
7%
7%
2%
-%
2%
39%
37%
25%
32%
38%
48%
33%
-%
11%
6%
Q2 2020
2,930
2,073
115
149
930
2,959
2,335
1.24
1.10
Average
Q1 2021 Q2 2021
3,864
2,764
137
210
1,363
4,200
2,349
1.38
1.21
4,181
2,954
147
207
1,351
4,618
2,334
1.40
1.21
% Change
Q2 2021 vs.
Q1 2021 Q2 2020
8%
7%
7%
(1)%
(1)%
10%
5%
(1)%
1%
-%
43%
42%
28%
39%
45%
56%
36%
-%
13%
10%
Source: Bloomberg
(1) Revenue weighted composite index calculated by BlackRock to approximate the impact of market fluctuations on BlackRock's equity base fees. The index is derived from publicly available market
indices that represent applicable AUM benchmarks for each equity portfolio, as selected by BlackRock. The market impact information for each equity portfolio used to calculate the index may be
substantially different from that shown. Index does not include portfolios that do not have an applicable market index. Index does not reflect BlackRock's investment performance, and is not indicative of
past or future results.
5View entire presentation