Moelis & Company Investment Banking Pitch Book
Rhombus Management Financial Projections
($ in millions)
Revenues
License
Product & Other
Total Revenues
% Growth
Total COGS
Gross Profit
Gross Margin
Operating Expenses
Sales & Marketing
Research & Development
General & Administrative
Total Operating Expenses
Operating Income
Adjusted EBITDA
EBITDA Margin
2013A
$125,4
$90.2
$137.8
$109.3 $122.8 $130.7
77.8
54.1
70.2
$215.6
$163.5
69.1
$192.0
17.4%
$200.8
(12.6%) (7.6%) (18.0%)
41.8%
$19.5
25.3
47.8
$92.6
($2.4)
$57.9
Fiscal Year Ended March 31,
2015A
2016E
26.9%
2014A
$132.5
66.7
$199.2
$104.0
$95.3
47.8%
$19.7
27.1
50,6
$97.4
($2.2)
$65.1
32.7%
$82.7
$80.8
$19.5
21.7
49.4
$90.6
($9.8)
$52.0
31.8%
$88.3
$103.7
54.0%
$20.0
52.2
$86.6
$17.1
2017E
$73.1
38.1%
$78.8
$122.1
60.8%
$20.8
21.6
45.6
$88.0
$34.0
583.3
41.5%
2018E
$138.9
70.4
$209.3
$77.0
$132.3
63.2%
$21.1
22.1
46.0
$89.2
$43.1
$90.9
43.4%
STRICTLY CONFIDENTIAL
MOELIS & COMPANY
OVERVIEW
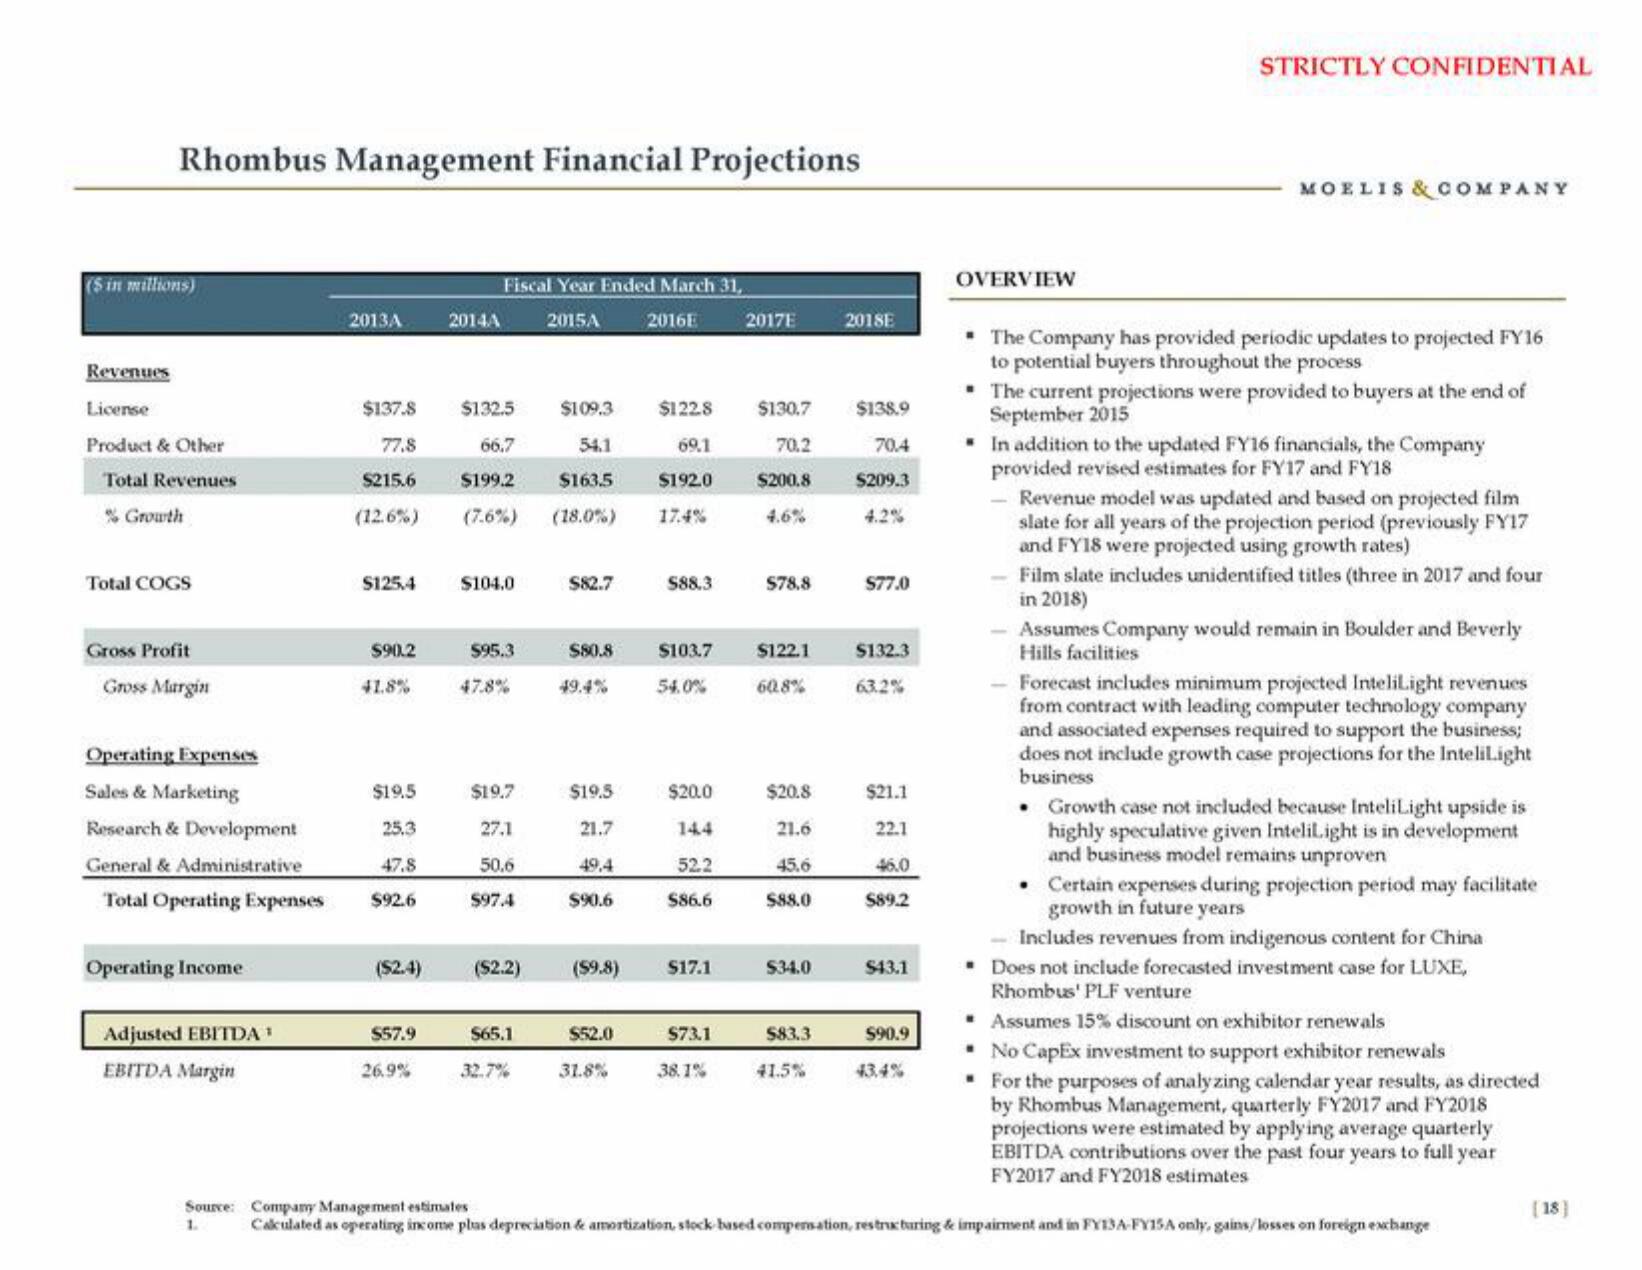
The Company has provided periodic updates to projected FY16
to potential buyers throughout the process
• The current projections were provided to buyers at the end of
September 2015
. In addition to the updated FY16 financials, the Company
provided revised estimates for FY17 and FY18
Revenue model was updated and based on projected film
slate for all years of the projection period (previously FY17
and FY18 were projected using growth rates)
-- Film slate includes unidentified titles (three in 2017 and four
in 2018)
Assumes Company would remain in Boulder and Beverly
Hills facilities
Forecast includes minimum projected InteliLight revenues
from contract with leading computer technology company
and associated expenses required to support the business;
does not include growth case projections for the Intelilight
business
• Growth case not included because InteliLight upside is
highly speculative given Intelil.ight is in development
and business model remains unproven
• Certain expenses during projection period may facilitate
growth in future years
Includes revenues from indigenous content for China
* Does not include forecasted investment case for LUXE,
Rhombus' PLF venture
▪ Assumes 15% discount on exhibitor renewals
No CapEx investment to support exhibitor renewals
• For the purposes of analyzing calendar year results, as directed
by Rhombus Management, quarterly FY2017 and FY2018
projections were estimated by applying average quarterly
EBITDA contributions over the past four years to full year
FY2017 and FY2018 estimates
Source: Company Management estimates
Calculated as operating income plus depreciation & amortization, stock based compensation, restructuring & impairment and in FY13A-FY15A only, gains/losses on foreign exchange
[18]View entire presentation