Solar Industry Update
Percent of Planned Solar, Wind, and
Battery Markets Located in Energy
Communities
Click here to interactively view
this data on Tableau Public.
Out of Energy Community
In Energy Community
Capacity (GW)
100
80
10
40
20
20
0
70%
% Capacity in Energy Community
60%
X% Capacity in Energy Community (new projects)
50%
40%
30%
Added Planned
Projects
Planned Projects
20%
.
Planned (Sep. Planned (Sep. Planned (Sep. Planned (Sep. Planned (Sep. Planned (Sep.
2022)
2023)
2022)
2023)
2022)
2023)
- 10%
0%
Note: based on EIA data, there werende planned offshore wits announced between septem22nd September 2023.
Additionally, the latitude and longitude of these projects reported in EIA Form 860 likely does not reflect the location in which these
projects will determine their eligibility (i.e., the point of interconnection).
Sources: U.S. Energy Information Administration (EIA), EIA Form 860 (November 2022, November 2023).
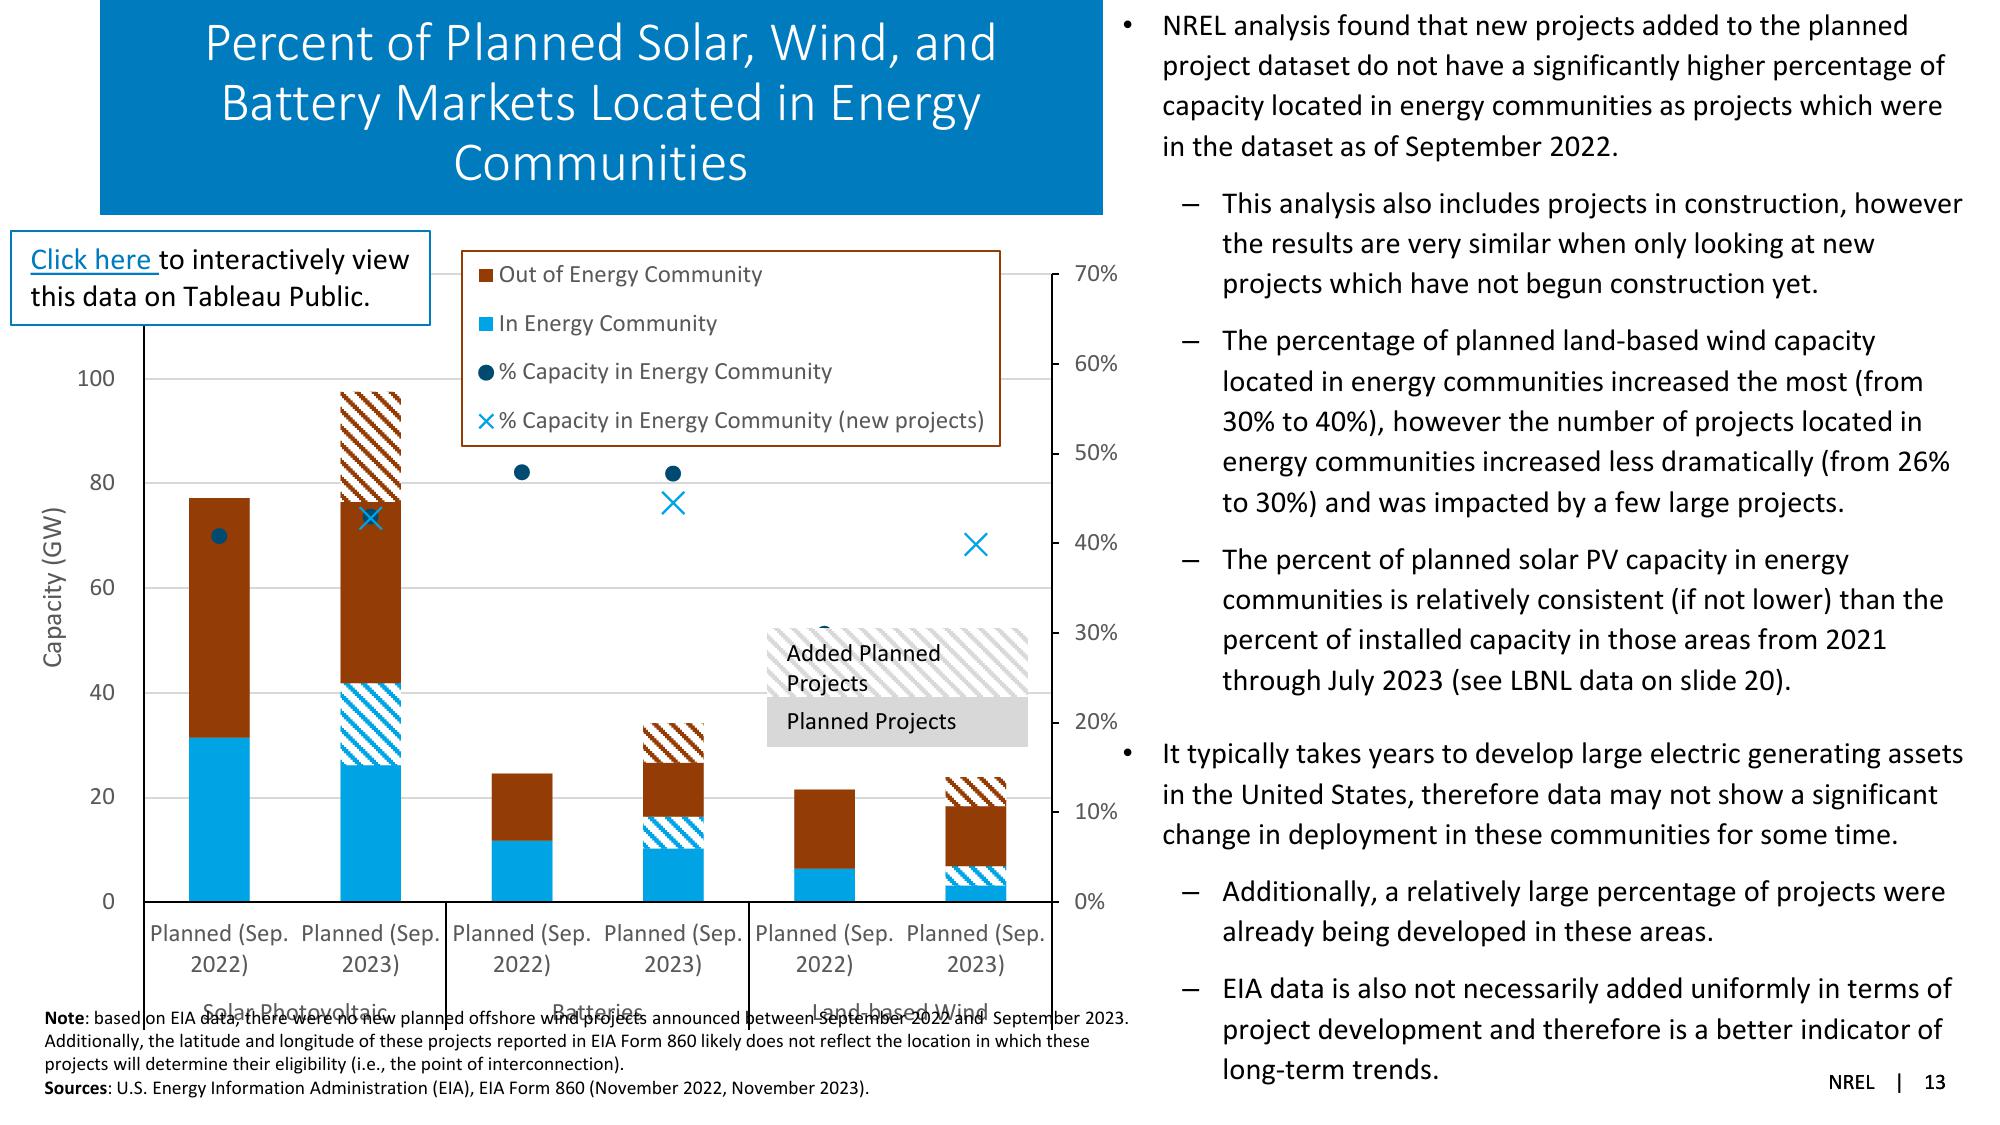
NREL analysis found that new projects added to the planned
project dataset do not have a significantly higher percentage of
capacity located in energy communities as projects which were
in the dataset as of September 2022.
-
-
This analysis also includes projects in construction, however
the results are very similar when only looking at new
projects which have not begun construction yet.
The percentage of planned land-based wind capacity
located in energy communities increased the most (from
30% to 40%), however the number of projects located in
energy communities increased less dramatically (from 26%
to 30%) and was impacted by a few large projects.
The percent of planned solar PV capacity in energy
communities is relatively consistent (if not lower) than the
percent of installed capacity in those areas from 2021
through July 2023 (see LBNL data on slide 20).
It typically takes years to develop large electric generating assets
in the United States, therefore data may not show a significant
change in deployment in these communities for some time.
Additionally, a relatively large percentage of projects were
already being developed in these areas.
EIA data is also not necessarily added uniformly in terms of
project development and therefore is a better indicator of
long-term trends.
NREL 13View entire presentation