Wix Results Presentation Deck
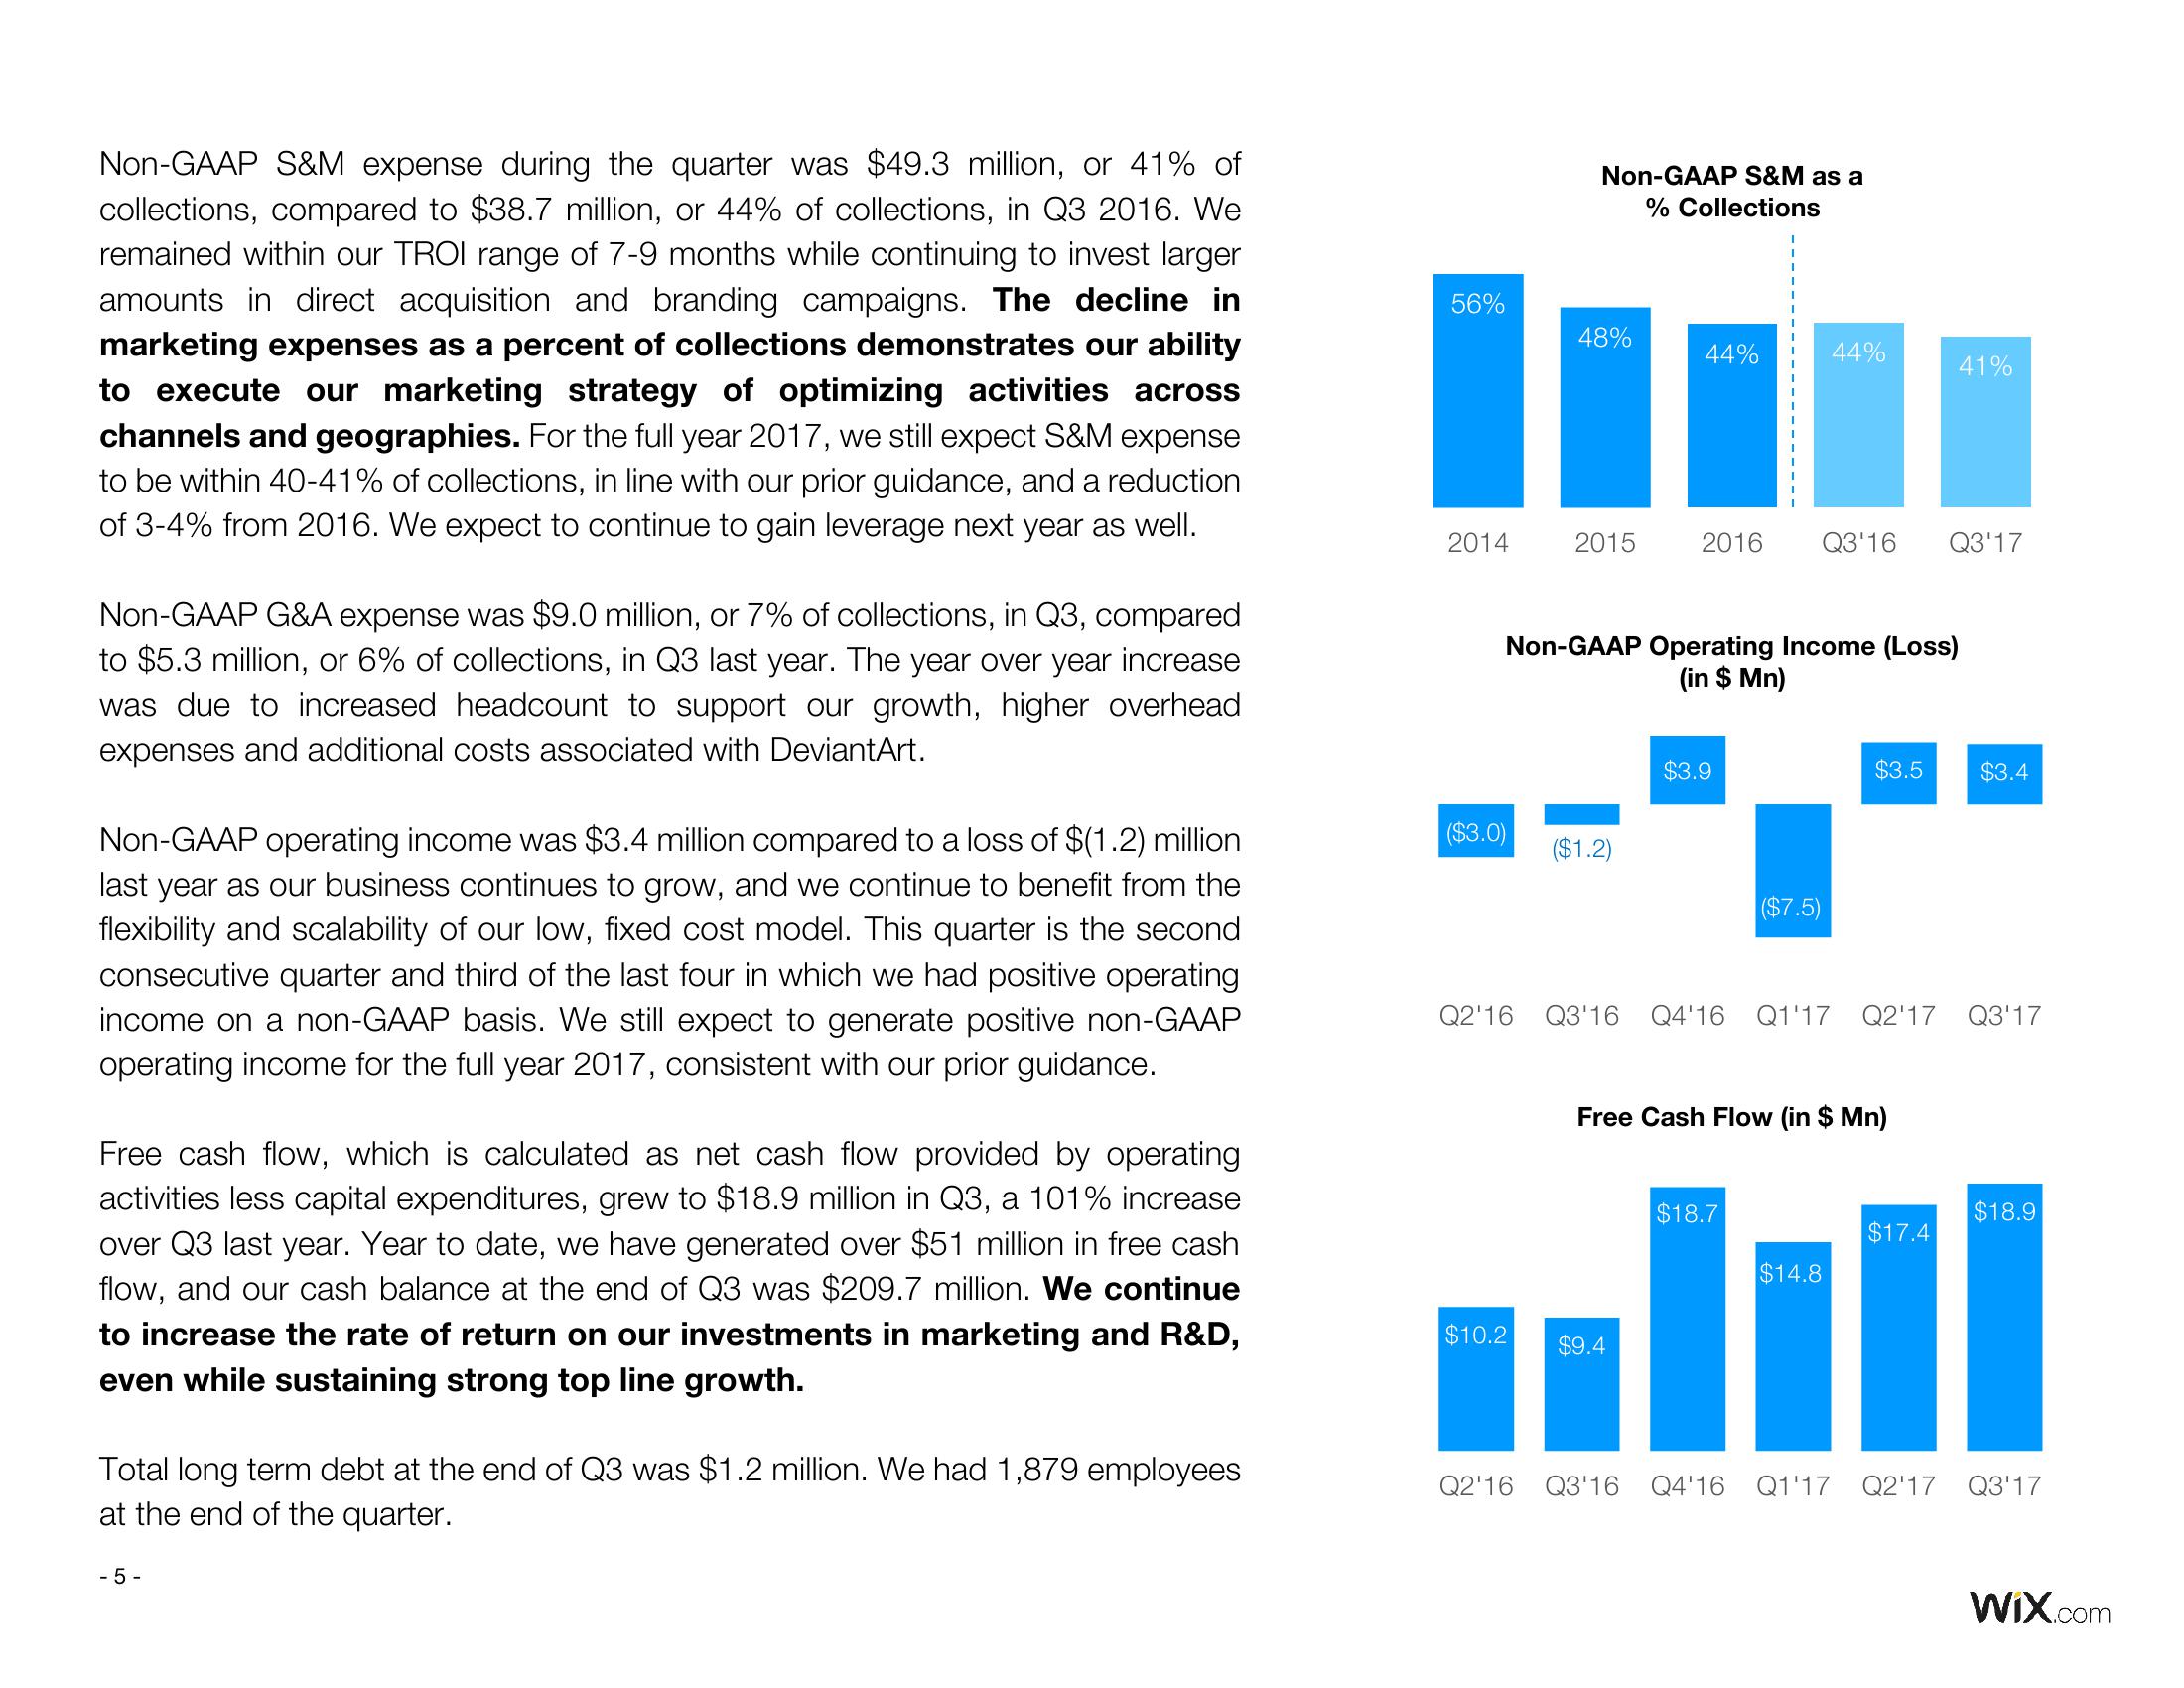
Non-GAAP S&M expense during the quarter was $49.3 million, or 41% of
collections, compared to $38.7 million, or 44% of collections, in Q3 2016. We
remained within our TROI range of 7-9 months while continuing to invest larger
amounts in direct acquisition and branding campaigns. The decline in
marketing expenses as a percent of collections demonstrates our ability
to execute our marketing strategy of optimizing activities across
channels and geographies. For the full year 2017, we still expect S&M expense
to be within 40-41% of collections, in line with our prior guidance, and a reduction
of 3-4% from 2016. We expect to continue to gain leverage next year as well.
Non-GAAP G&A expense was $9.0 million, or 7% of collections, in Q3, compared
to $5.3 million, or 6% of collections, in Q3 last year. The year over year increase
was due to increased headcount to support our growth, higher overhead
expenses and additional costs associated with DeviantArt.
Non-GAAP operating income was $3.4 million compared to a loss of $(1.2) million
last year as our business continues to grow, and we continue to benefit from the
flexibility and scalability of our low, fixed cost model. This quarter is the second
consecutive quarter and third of the last four in which we had positive operating
income on a non-GAAP basis. We still expect to generate positive non-GAAP
operating income for the full year 2017, consistent with our prior guidance.
Free cash flow, which is calculated as net cash flow provided by operating
activities less capital expenditures, grew to $18.9 million in Q3, a 101% increase
over Q3 last year. Year to date, we have generated over $51 million in free cash
flow, and our cash balance at the end of Q3 was $209.7 million. We continue
to increase the rate of return on our investments in marketing and R&D,
even while sustaining strong top line growth.
Total long term debt at the end of Q3 was $1.2 million. We had 1,879 employees
at the end of the quarter.
- 5-
56%
2014
($3.0)
Q2'16
Non-GAAP S&M as a
% Collections
48%
$10.2
2015
44%
Non-GAAP Operating Income (Loss)
(in $ Mn)
($1.2)
44%
2016 Q3'16 Q3'17
$3.9
($7.5)
41%
$3.5 $3.4
Q3'16 Q4'16 Q1'17 Q2'17 Q3'17
Free Cash Flow (in $ Mn)
$18.7
$14.8
will
$9.4
$17.4
$18.9
Q2'16 Q3'16 Q4'16 Q1'17 Q2'17 Q3'17
WIX.comView entire presentation