Nerdy SPAC Presentation Deck
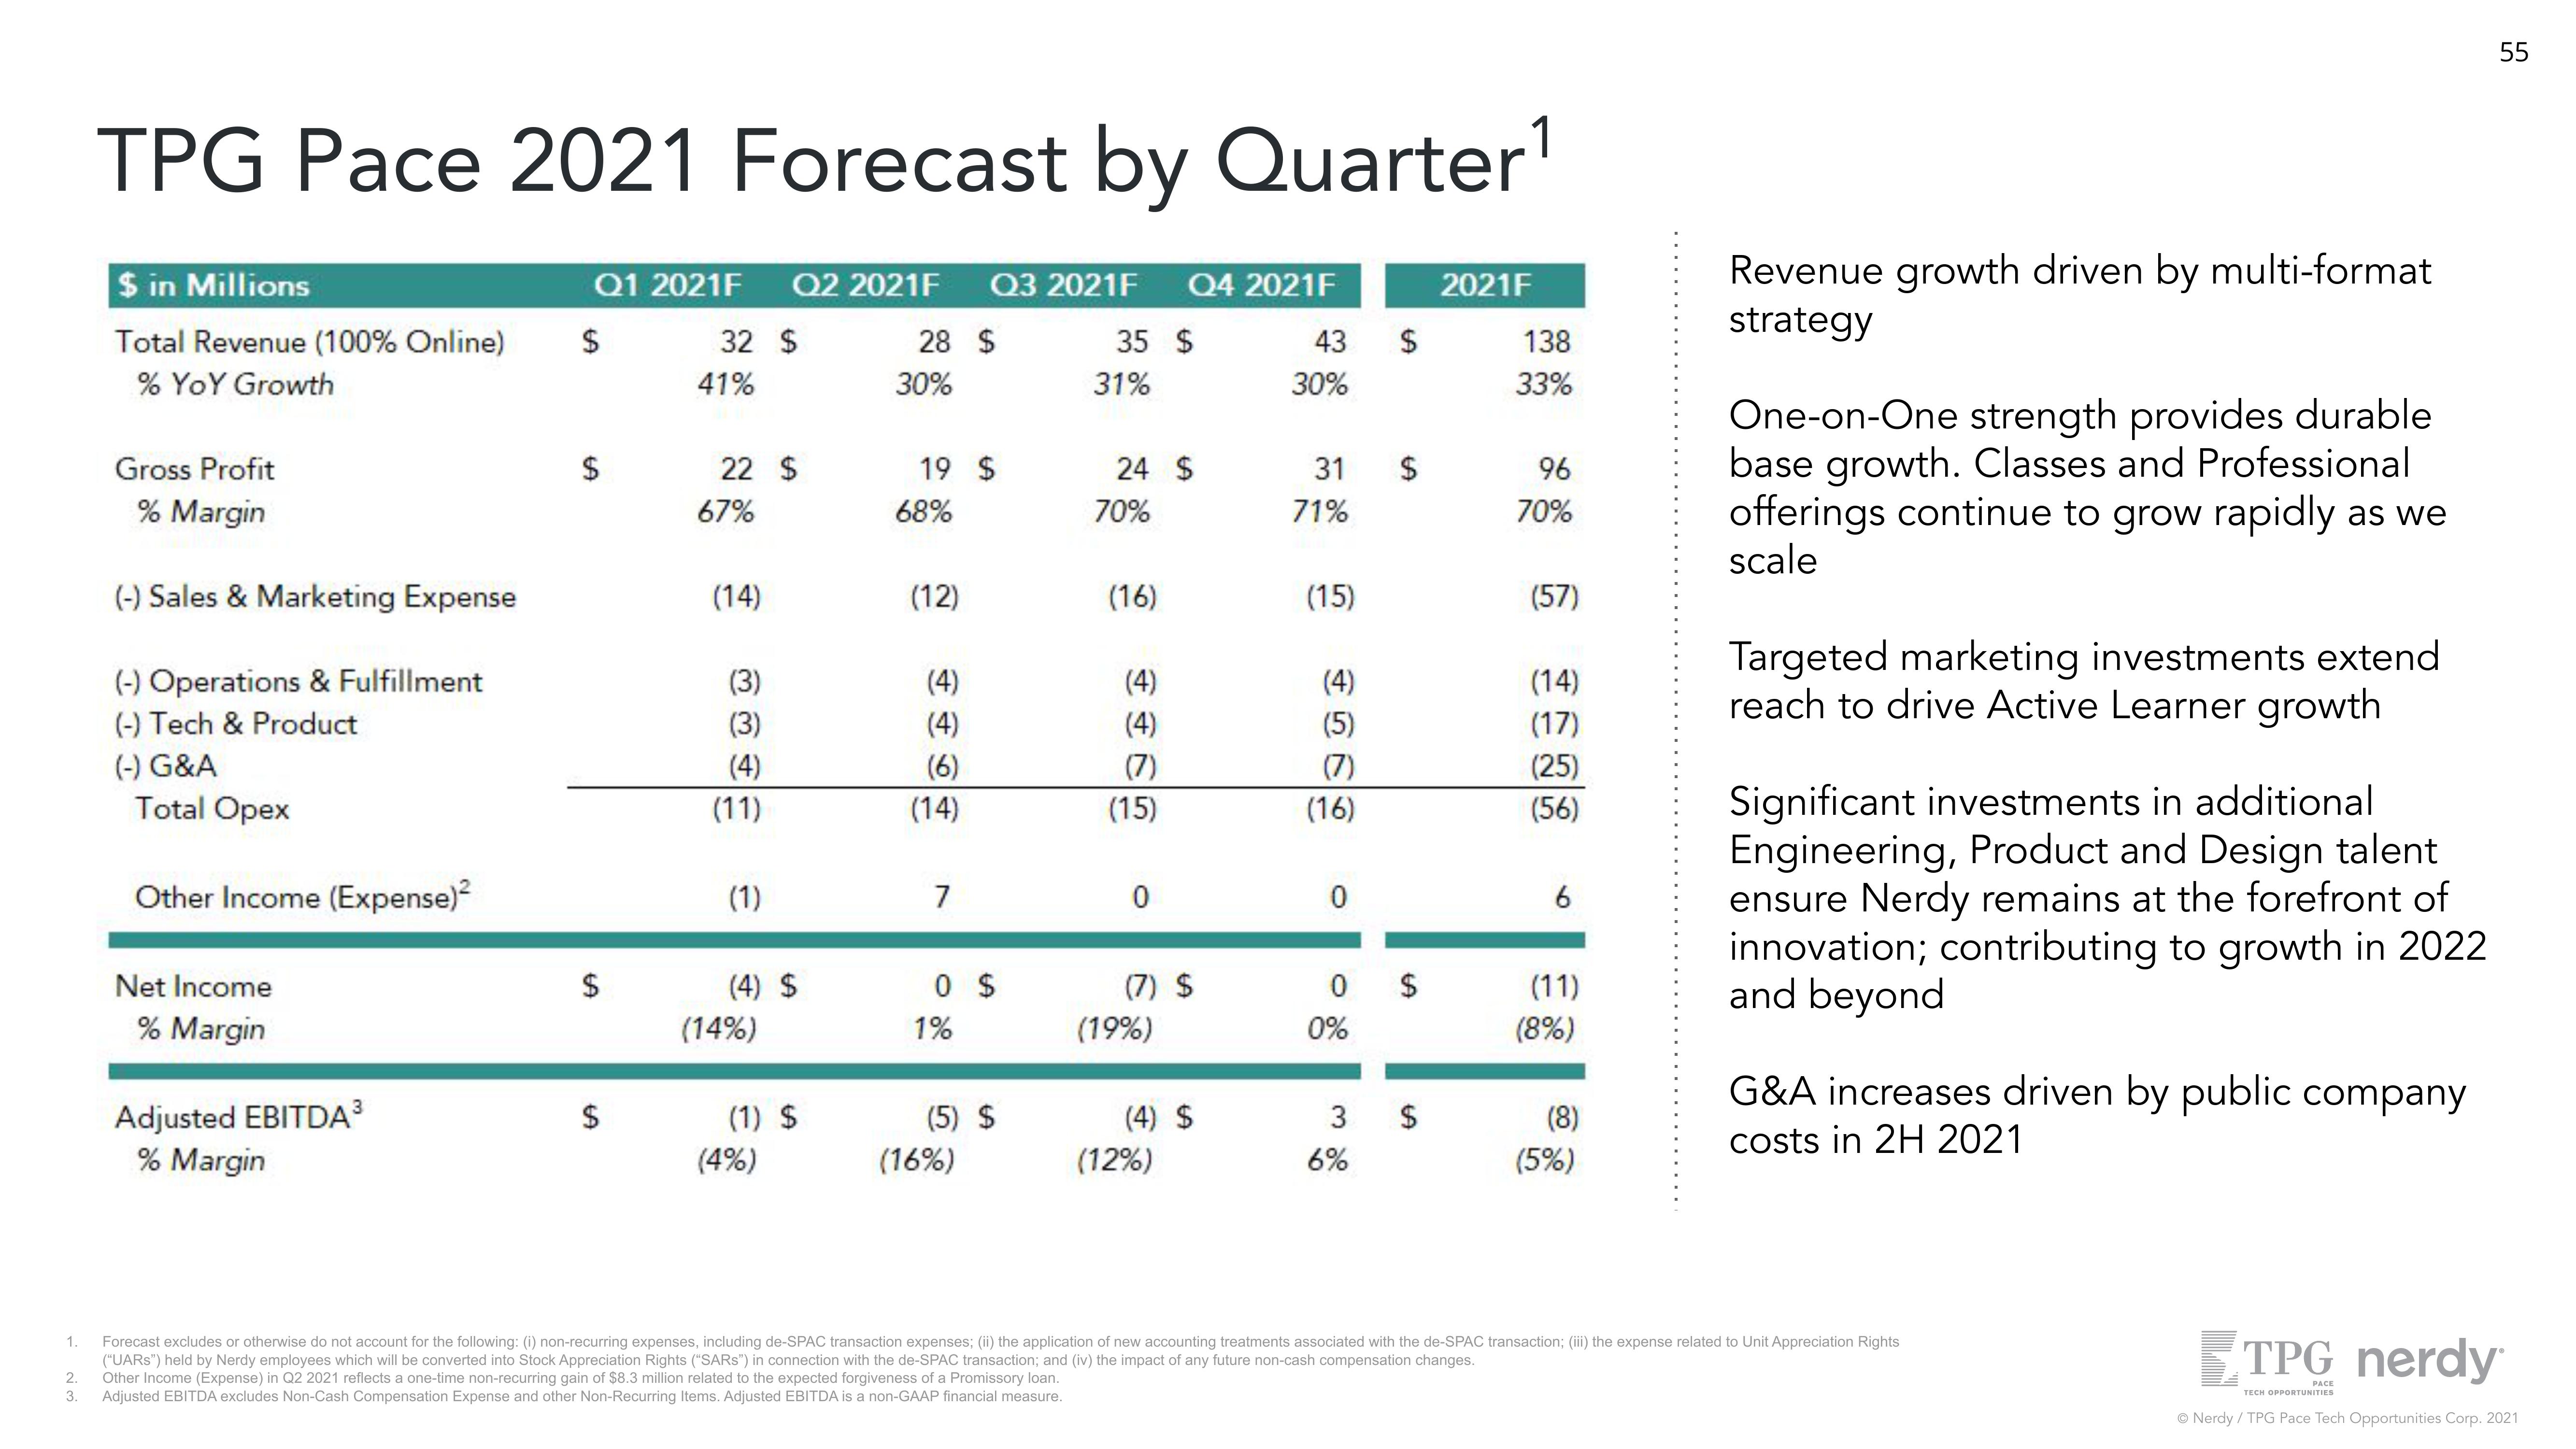
TPG Pace 2021 Forecast by Quarter¹
1.
$ in Millions
Total Revenue (100% Online)
% YoY Growth
Gross Profit
% Margin
(-) Sales Marketing Expense
(-) Operations & Fulfillment
(-) Tech & Product
(-) G&A
Total Opex
Other Income (Expense)²
Net Income
% Margin
Adjusted EBITDA³
% Margin
Q1 2021F
$
$
$
$
32 $
41%
22 $
67%
(14)
(3)
(3)
(4)
(11)
(1)
Q2 2021F Q3 2021F Q4 2021F
28 $
30%
35 $
31%
(4) $
(14%)
(1) $
(4%)
19 $
68%
(12)
(4)
(4)
(6)
(14)
7
0 $
1%
(5) $
(16%)
24 $
70%
(16)
(4)
(4)
(7)
(15)
0
(7) $
(19%)
(4) $
(12%)
43
30%
31
71%
(15)
(4)
(5)
(7)
(16)
0
0
0%
3
6%
$
$
$
$
2021F
138
33%
96
70%
(57)
(14)
(17)
(25)
(56)
6
(11)
(8%)
(8)
(5%)
Revenue growth driven by multi-format
strategy
One-on-One strength provides durable
base growth. Classes and Professional
offerings continue to grow rapidly as we
scale
Targeted marketing investments extend
reach to drive Active Learner growth
Significant investments in additional
Engineering, Product and Design talent
ensure Nerdy remains at the forefront of
innovation; contributing to growth in 2022
and beyond
G&A increases driven by public company
costs in 2H 2021
Forecast excludes or otherwise do not account for the following: (i) non-recurring expenses, including de-SPAC transaction expenses; (ii) the application of new accounting treatments associated with the de-SPAC transaction; (iii) the expense related to Unit Appreciation Rights
("UARS") held by Nerdy employees which will be converted into Stock Appreciation Rights ("SARS") in connection with the de-SPAC transaction; and (iv) the impact of any future non-cash compensation changes.
2
Other Income (Expense) in Q2 2021 reflects a one-time non-recurring gain of $8.3 million related to the expected forgiveness of a Promissory loan.
3. Adjusted EBITDA excludes Non-Cash Compensation Expense and other Non-Recurring Items. Adjusted EBITDA is a non-GAAP financial measure.
55
TPG nerdy
PACE
TECH OPPORTUNITIES
Ⓒ Nerdy / TPG Pace Tech Opportunities Corp. 2021View entire presentation