Apollo Global Management Investor Day Presentation Deck
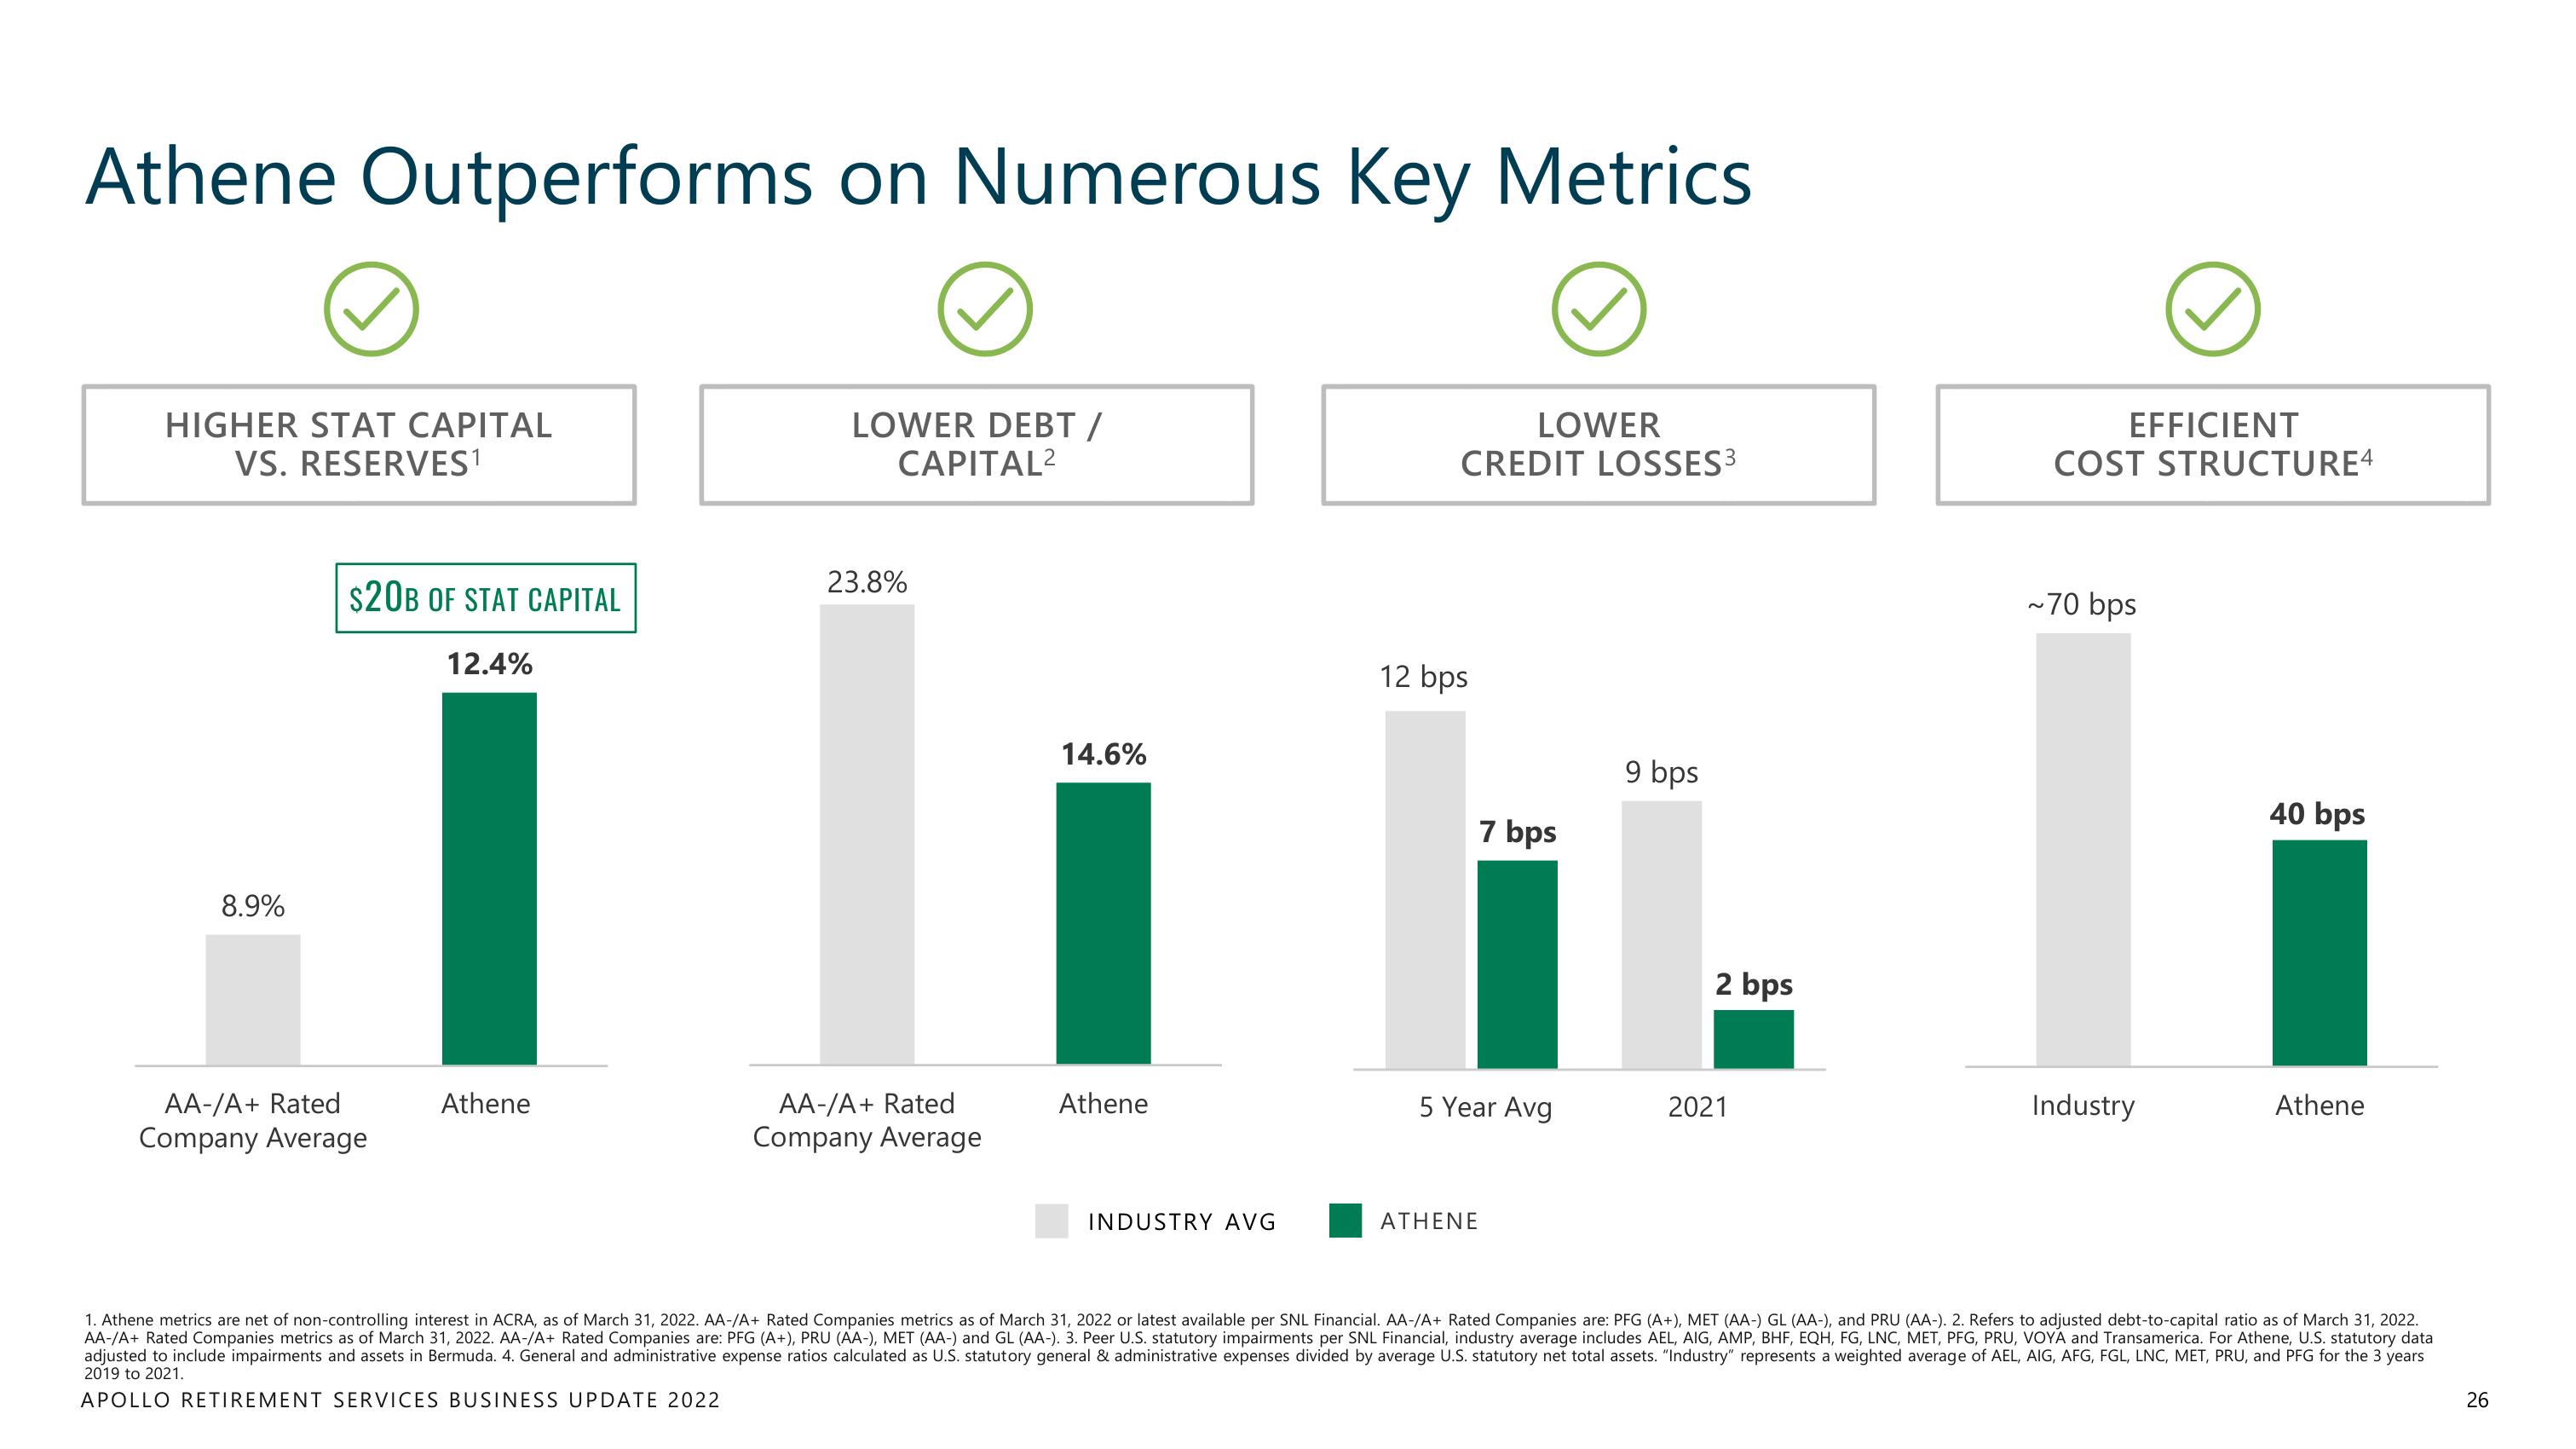
Athene Outperforms on Numerous Key Metrics
HIGHER STAT CAPITAL
VS. RESERVES1
8.9%
$20B OF STAT CAPITAL
AA-/A+ Rated
Company Average
12.4%
Athene
LOWER DEBT/
CAPITAL²
23.8%
AA-/A+ Rated
Company Average
14.6%
Athene
INDUSTRY AVG
CREDIT LOSSES3
12 bps
LOWER
ATHENE
7 bps
5 Year Avg
9 bps
2 bps
2021
EFFICIENT
COST STRUCTURE4
~70 bps
Industry
40 bps
Athene
1. Athene metrics are net of non-controlling interest in ACRA, as of March 31, 2022. AA-/A+ Rated Companies metrics as of March 31, 2022 or latest available per SNL Financial. AA-/A+ Rated Companies are: PFG (A+), MET (AA-) GL (AA-), and PRU (AA-). 2. Refers to adjusted debt-to-capital ratio as of March 31, 2022.
AA-/A+ Rated Companies metrics as of March 31, 2022. AA-/A+ Rated Companies are: PFG (A+), PRU (AA-), MET (AA-) and GL (AA-). 3. Peer U.S. statutory impairments per SNL Financial, industry average includes AEL, AIG, AMP, BHF, EQH, FG, LNC, MET, PFG, PRU, VOYA and Transamerica. For Athene, U.S. statutory data
adjusted to include impairments and assets in Bermuda. 4. General and administrative expense ratios calculated as U.S. statutory general & administrative expenses divided by average U.S. statutory net total assets. "Industry" represents a weighted average of AEL, AIG, AFG, FGL, LNC, MET, PRU, and PFG for the 3 years
2019 to 2021.
APOLLO RETIREMENT SERVICES BUSINESS UPDATE 2022
26View entire presentation