TPG Results Presentation Deck
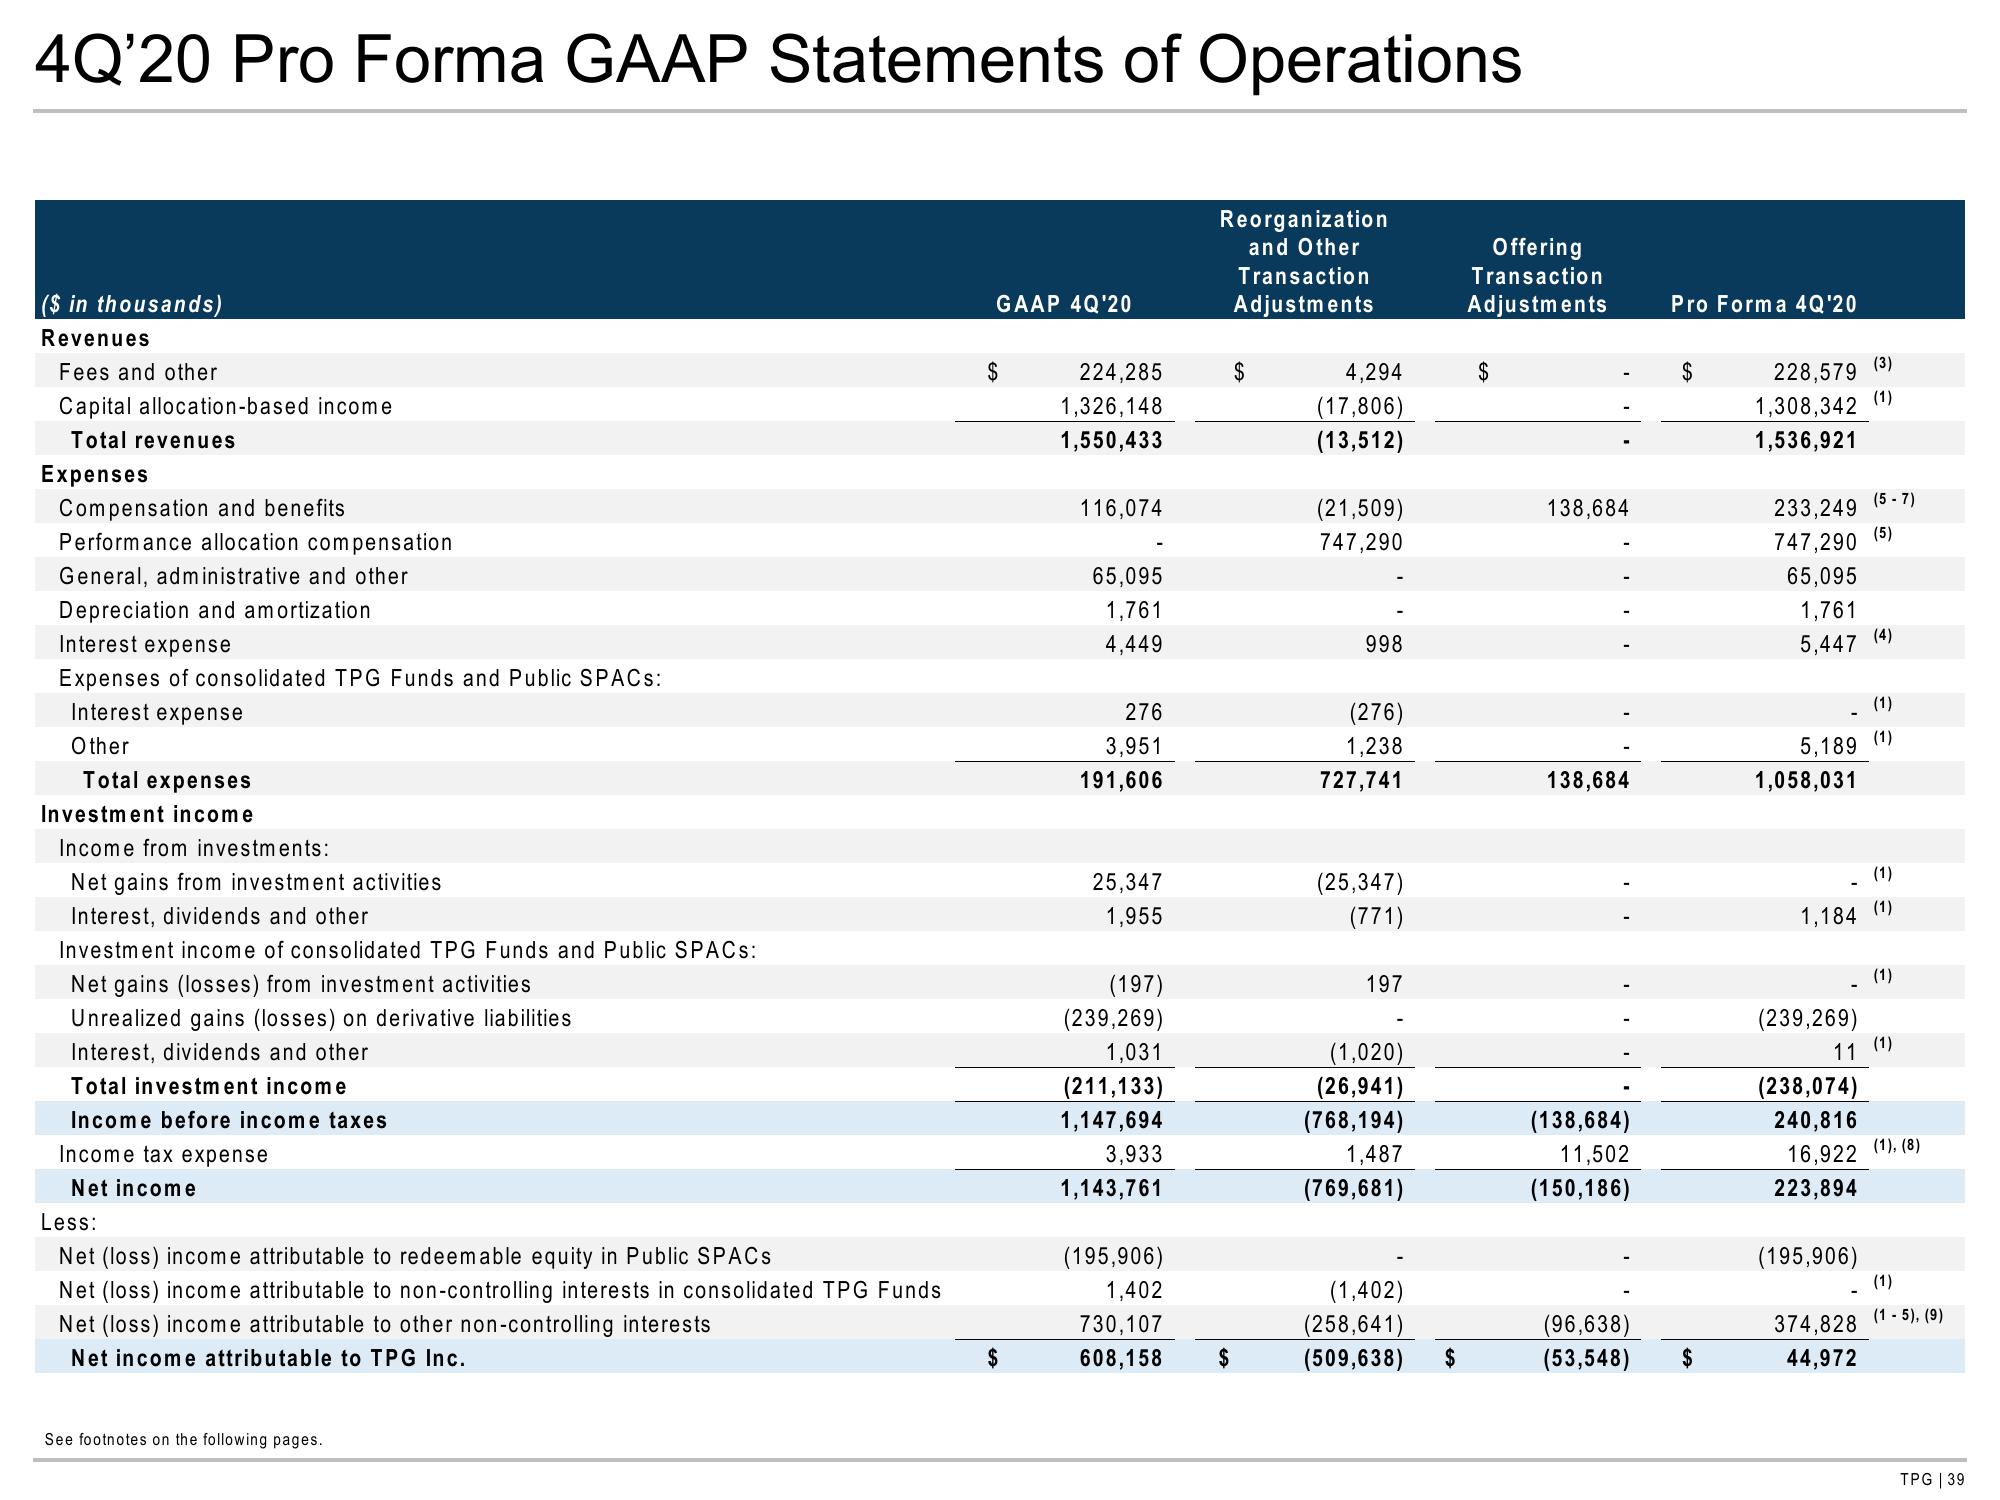
4Q'20 Pro Forma GAAP Statements of Operations
($ in thousands)
Revenues
Fees and other
Capital allocation-based income
Total revenues
Expenses
Compensation and benefits
Performance allocation compensation
General, administrative and other
Depreciation and amortization
Interest expense
Expenses of consolidated TPG Funds and Public SPACs:
Interest expense
Other
Total expenses
Investment income
Income from investments:
Net gains from investment activities
Interest, dividends and other
Investment income of consolidated TPG Funds and Public SPACs:
Net gains (losses) from investment activities
Unrealized gains (losses) on derivative liabilities
Interest, dividends and other
Total investment income
Income before income taxes
Income tax expense
Net income
Less:
Net (loss) income attributable to redeemable equity in Public SPACS
Net (loss) income attributable to non-controlling interests in consolidated TPG Funds
Net (loss) income attributable to other non-controlling interests
Net income attributable to TPG Inc.
See footnotes on the following pages.
GAAP 4Q'20
$
224,285
1,326,148
1,550,433
116,074
65,095
1,761
4,449
276
3,951
191,606
25,347
1,955
(197)
(239,269)
1,031
(211,133)
1,147,694
3,933
1,143,761
(195,906)
1,402
730,107
608,158
Reorganization
and Other
Transaction
Adjustments
$
4,294
(17,806)
(13,512)
(21,509)
747,290
998
(276)
1,238
727,741
(25,347)
(771)
197
(1,020)
(26,941)
(768,194)
1,487
(769,681)
(1,402)
(258,641)
(509,638)
$
Offering
Transaction
Adjustments
$
138,684
138,684
(138,684)
11,502
(150,186)
(96,638)
(53,548)
Pro Forma 4Q'20
$
$
228,579
1,308,342
1,536,921
233,249
747,290
65,095
1,761
5,447
(239,269)
(1)
5,189 (1)
1,058,031
(3)
(1)
(1)
1,184 (1)
(238,074)
240,816
16,922
223,894
(5-7)
(5)
(195,906)
(4)
374,828
44,972
11 (1)
(1)
(1), (8)
(1)
(1-5), (9)
TPG | 39View entire presentation