Credit Suisse Investment Banking Pitch Book
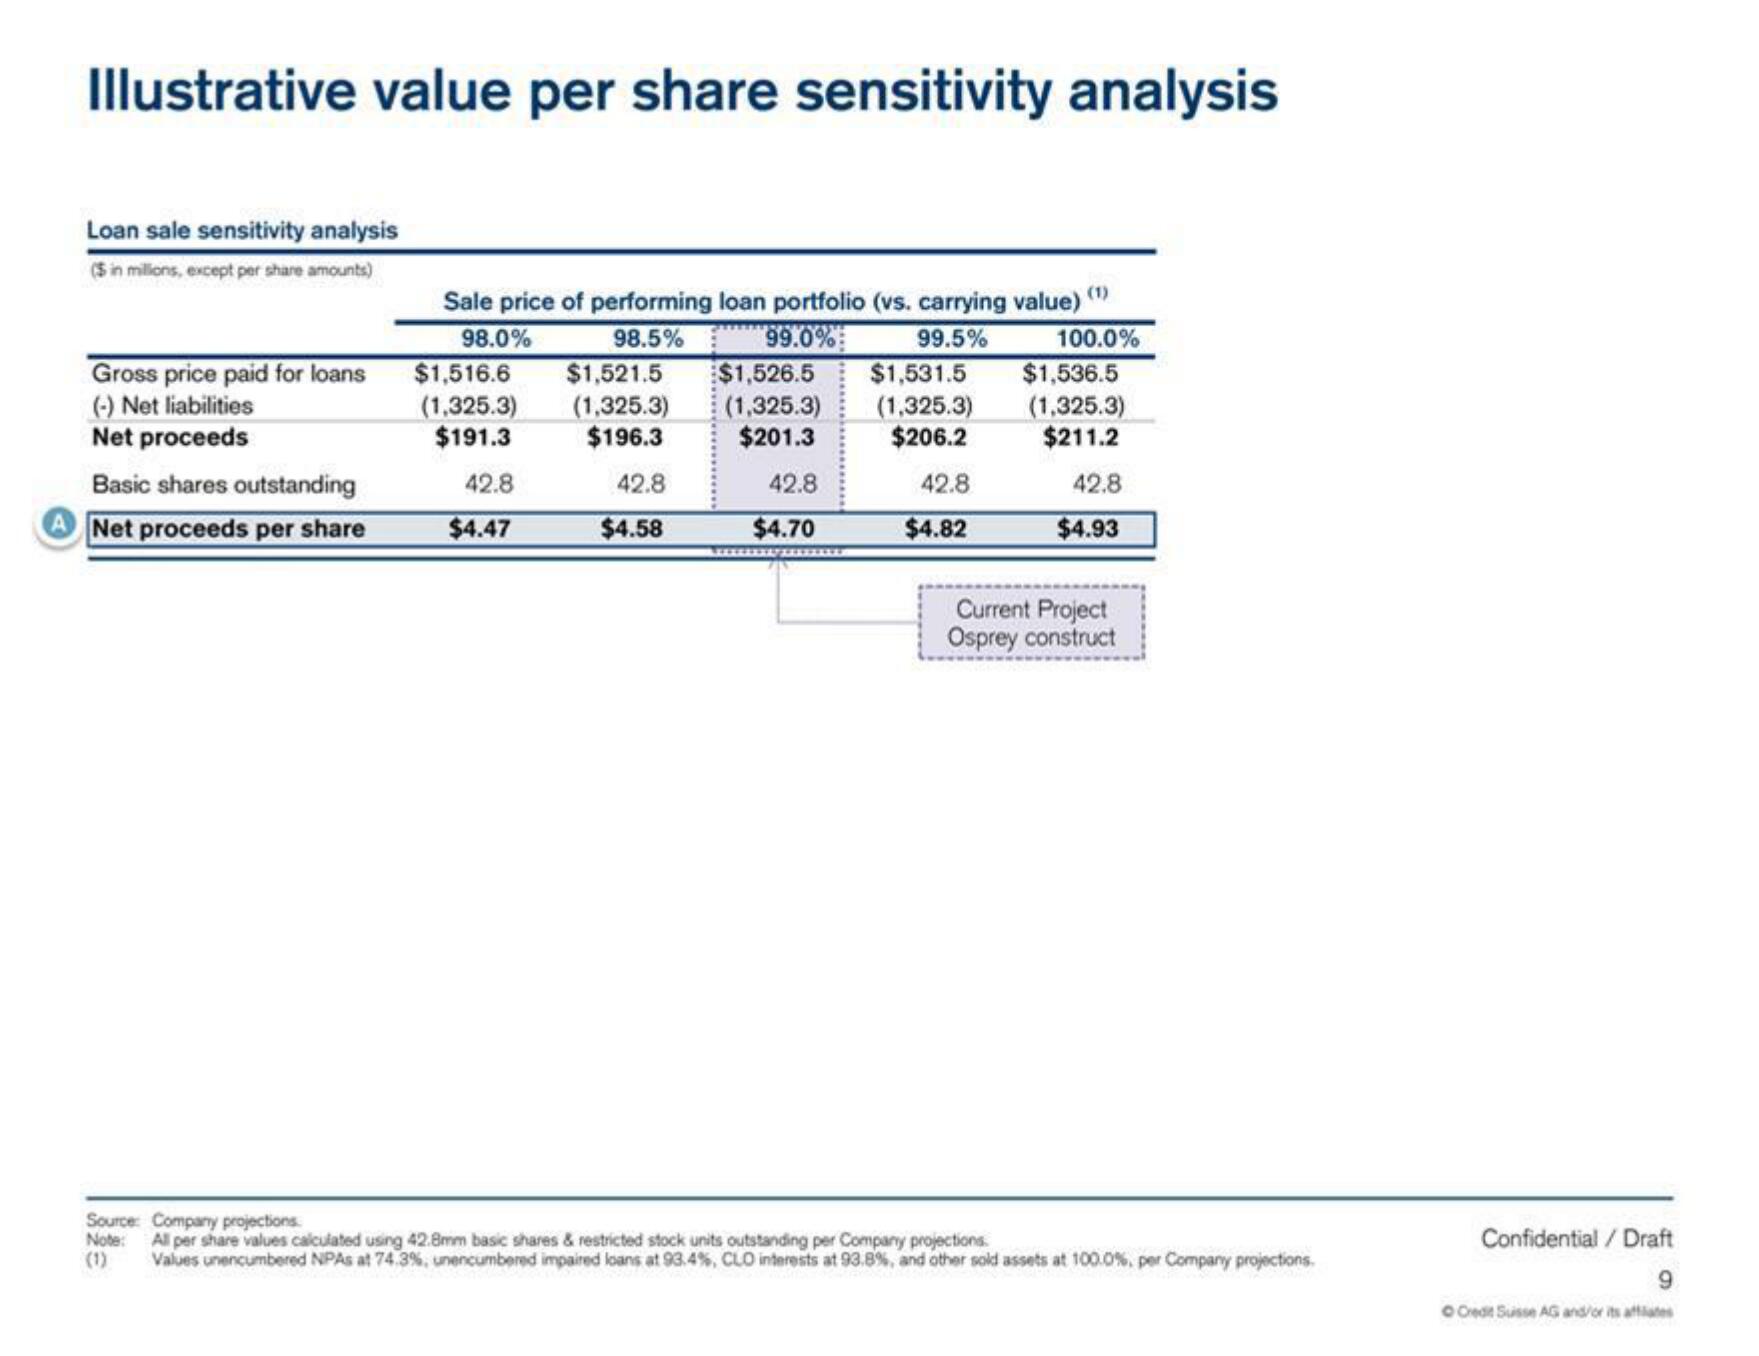
Illustrative value per share sensitivity analysis
Loan sale sensitivity analysis
(5 in millions, except per share amounts)
Gross price paid for loans
(-) Net liabilities
Net proceeds
Basic shares outstanding
A Net proceeds per share
Sale price of performing loan portfolio (vs. carrying value) (¹)
98.0%
98.5%
99.0%
99.5%
100.0%
$1,516.6 $1,521.5 $1,526.5
(1,325.3)
(1,325.3)
(1,325.3)
$191.3
$196.3
$201.3
42.8
$4.47
42.8
$4.58
42.8
$4.70
***********
$1,531.5
(1,325.3)
$206.2
42.8
$4.82
$1,536.5
(1,325.3)
$211.2
42.8
$4.93
Current Project
Osprey construct
Source: Company projections
All per share values calculated using 42.8mm basic shares & restricted stock units outstanding per Company projections.
Note:
(1)
Values unencumbered NPAs at 74.3%, unencumbered impaired loans at 93.4%, CLO interests at 93.8%, and other sold assets at 100.0%, per Company projections.
Confidential / Draft
9
O Credit Suisse AG and/or its affiliatesView entire presentation