Shift SPAC Presentation Deck
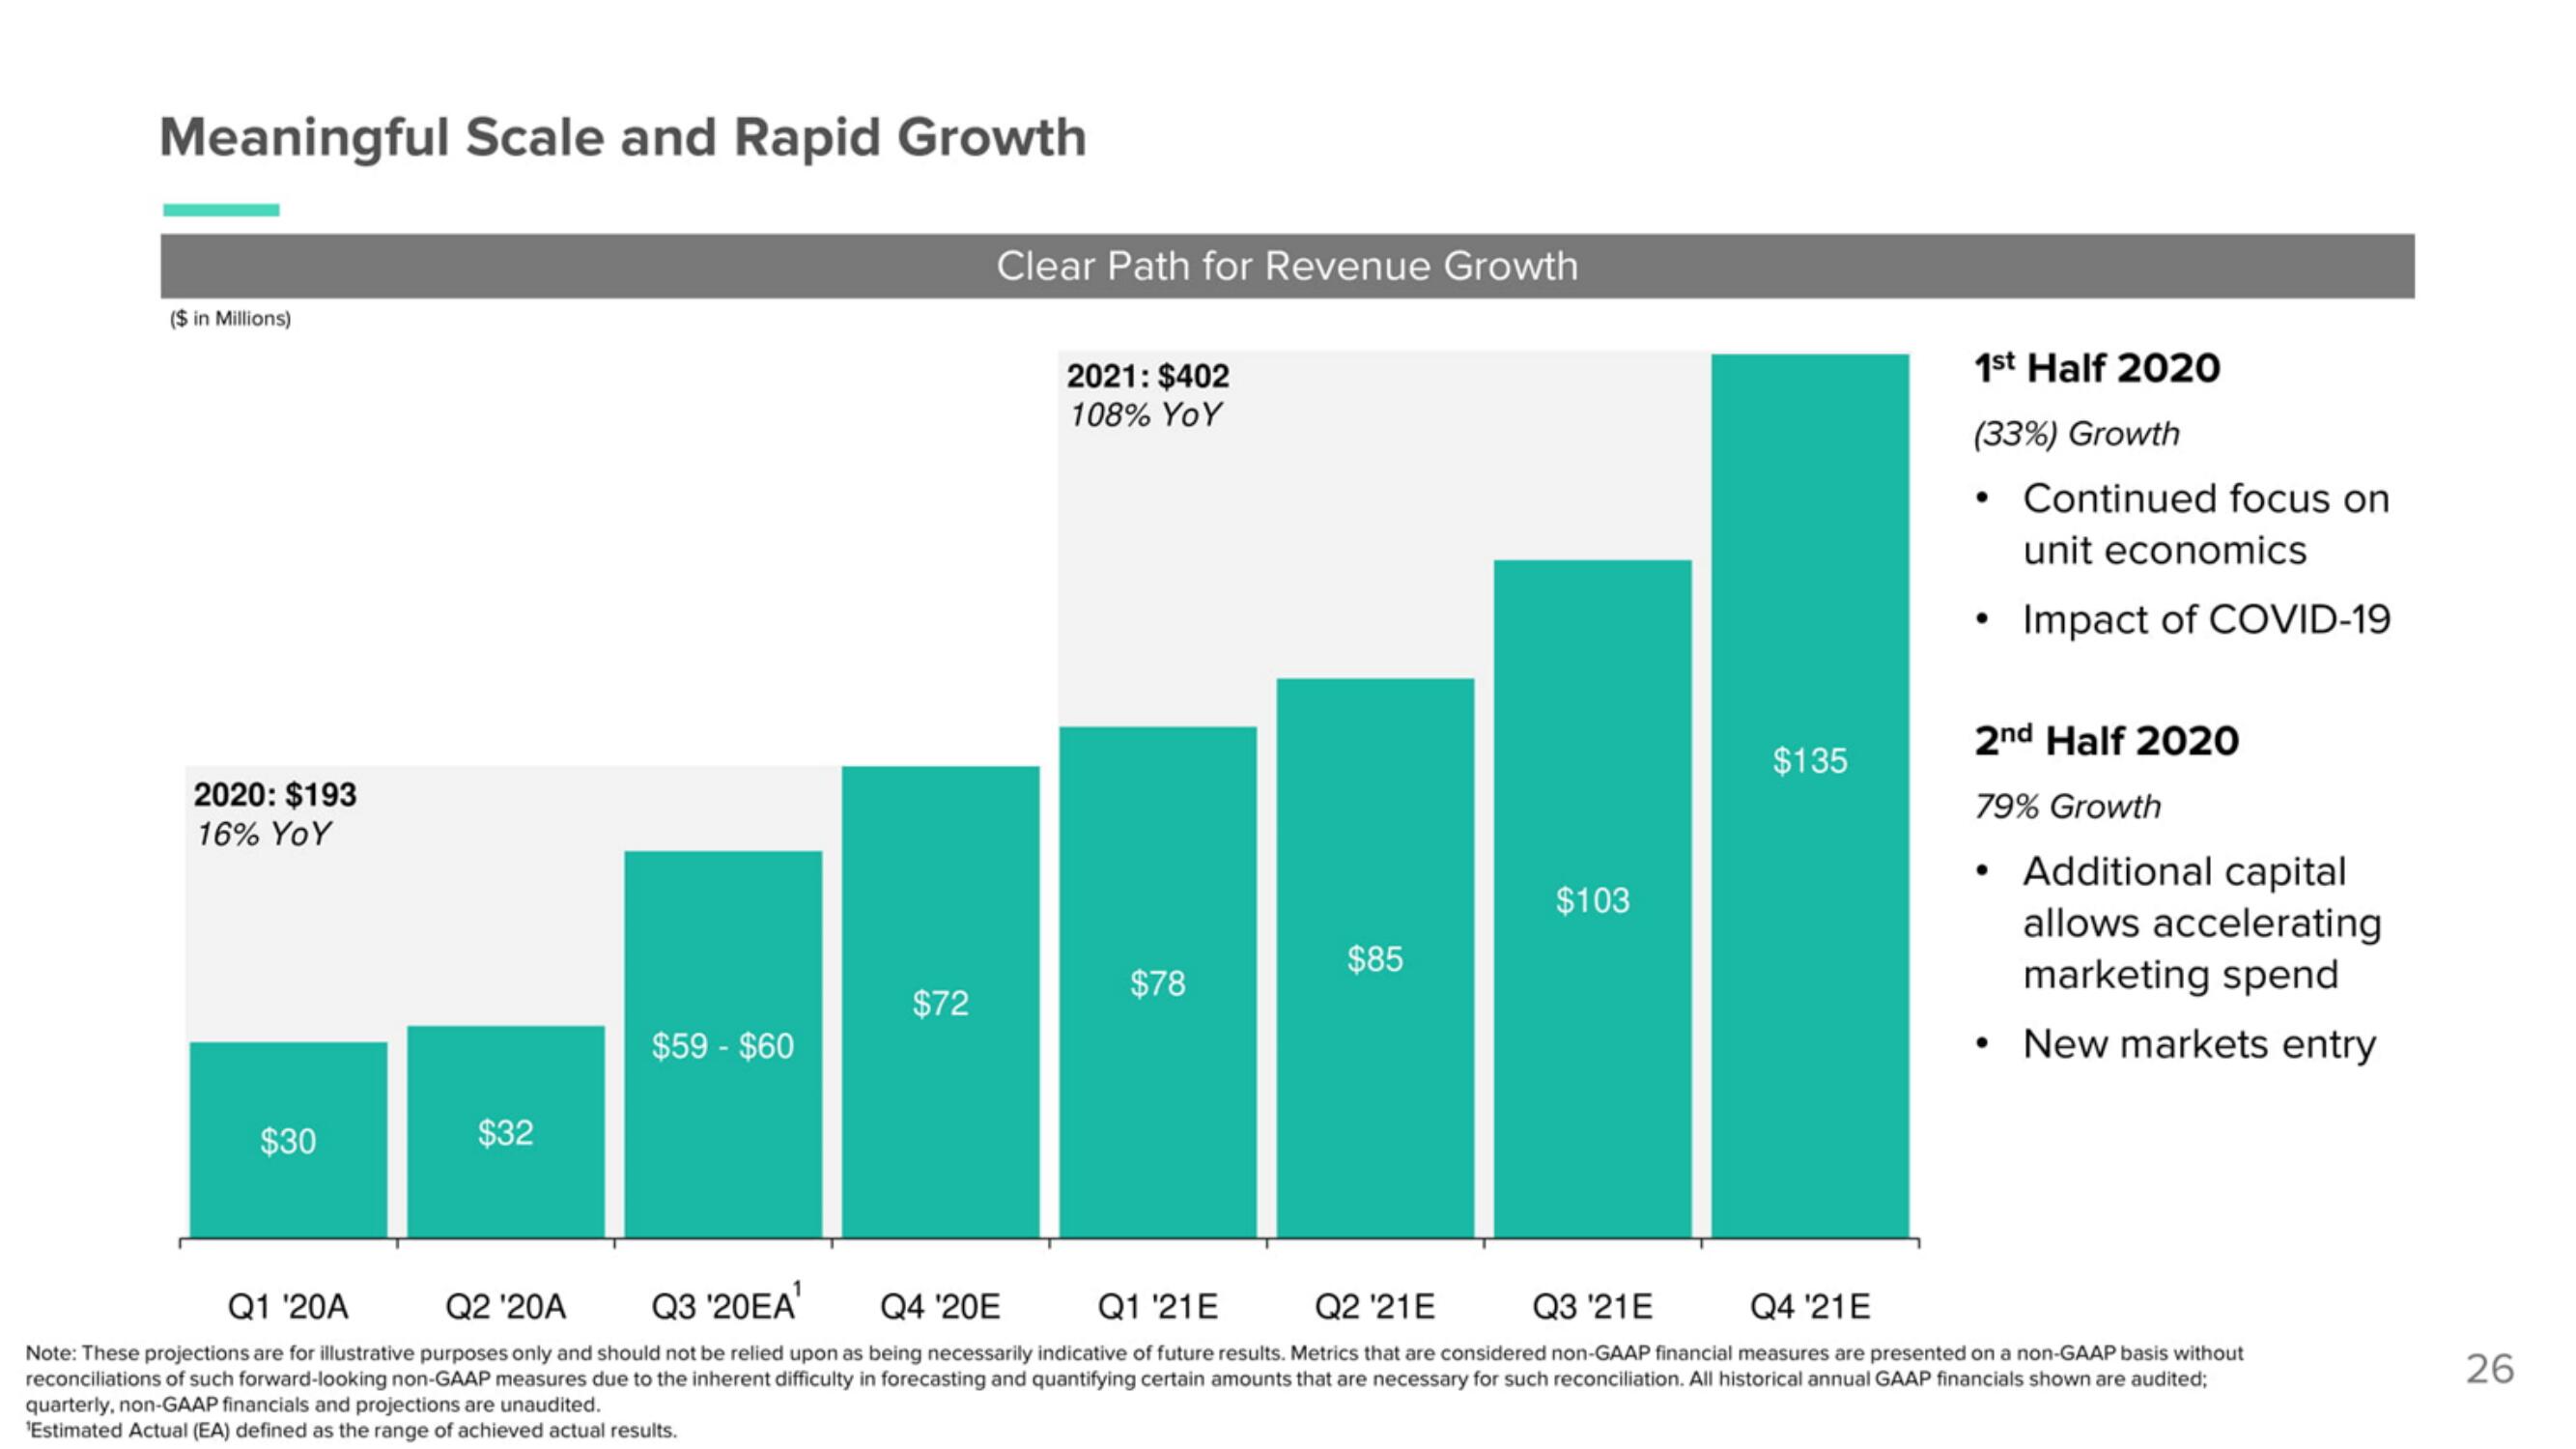
Meaningful Scale and Rapid Growth
($ in Millions)
2020: $193
16% YoY
$30
$32
$59 - $60
$72
Clear Path for Revenue Growth
2021: $402
108% YoY
$78
$85
$103
$135
1st Half 2020
(33%) Growth
. Continued focus on
unit economics
• Impact of COVID-19
2nd Half 2020
79% Growth
●
• Additional capital
allows accelerating
marketing spend
• New markets entry
Q3 '20EA
Q4 '20E
Q1 '21E
Q2 '21E
Q3 '21E
Q4 '21E
Q1 '20A Q2 '20A
Note: These projections are for illustrative purposes only and should not be relied upon as being necessarily indicative of future results. Metrics that are considered non-GAAP financial measures are presented on a non-GAAP basis without
reconciliations of such forward-looking non-GAAP measures due to the inherent difficulty in forecasting and quantifying certain amounts that are necessary for such reconciliation. All historical annual GAAP financials shown are audited;
quarterly, non-GAAP financials and projections are unaudited.
¹Estimated Actual (EA) defined as the range of achieved actual results.
26View entire presentation