Elms SPAC Presentation Deck
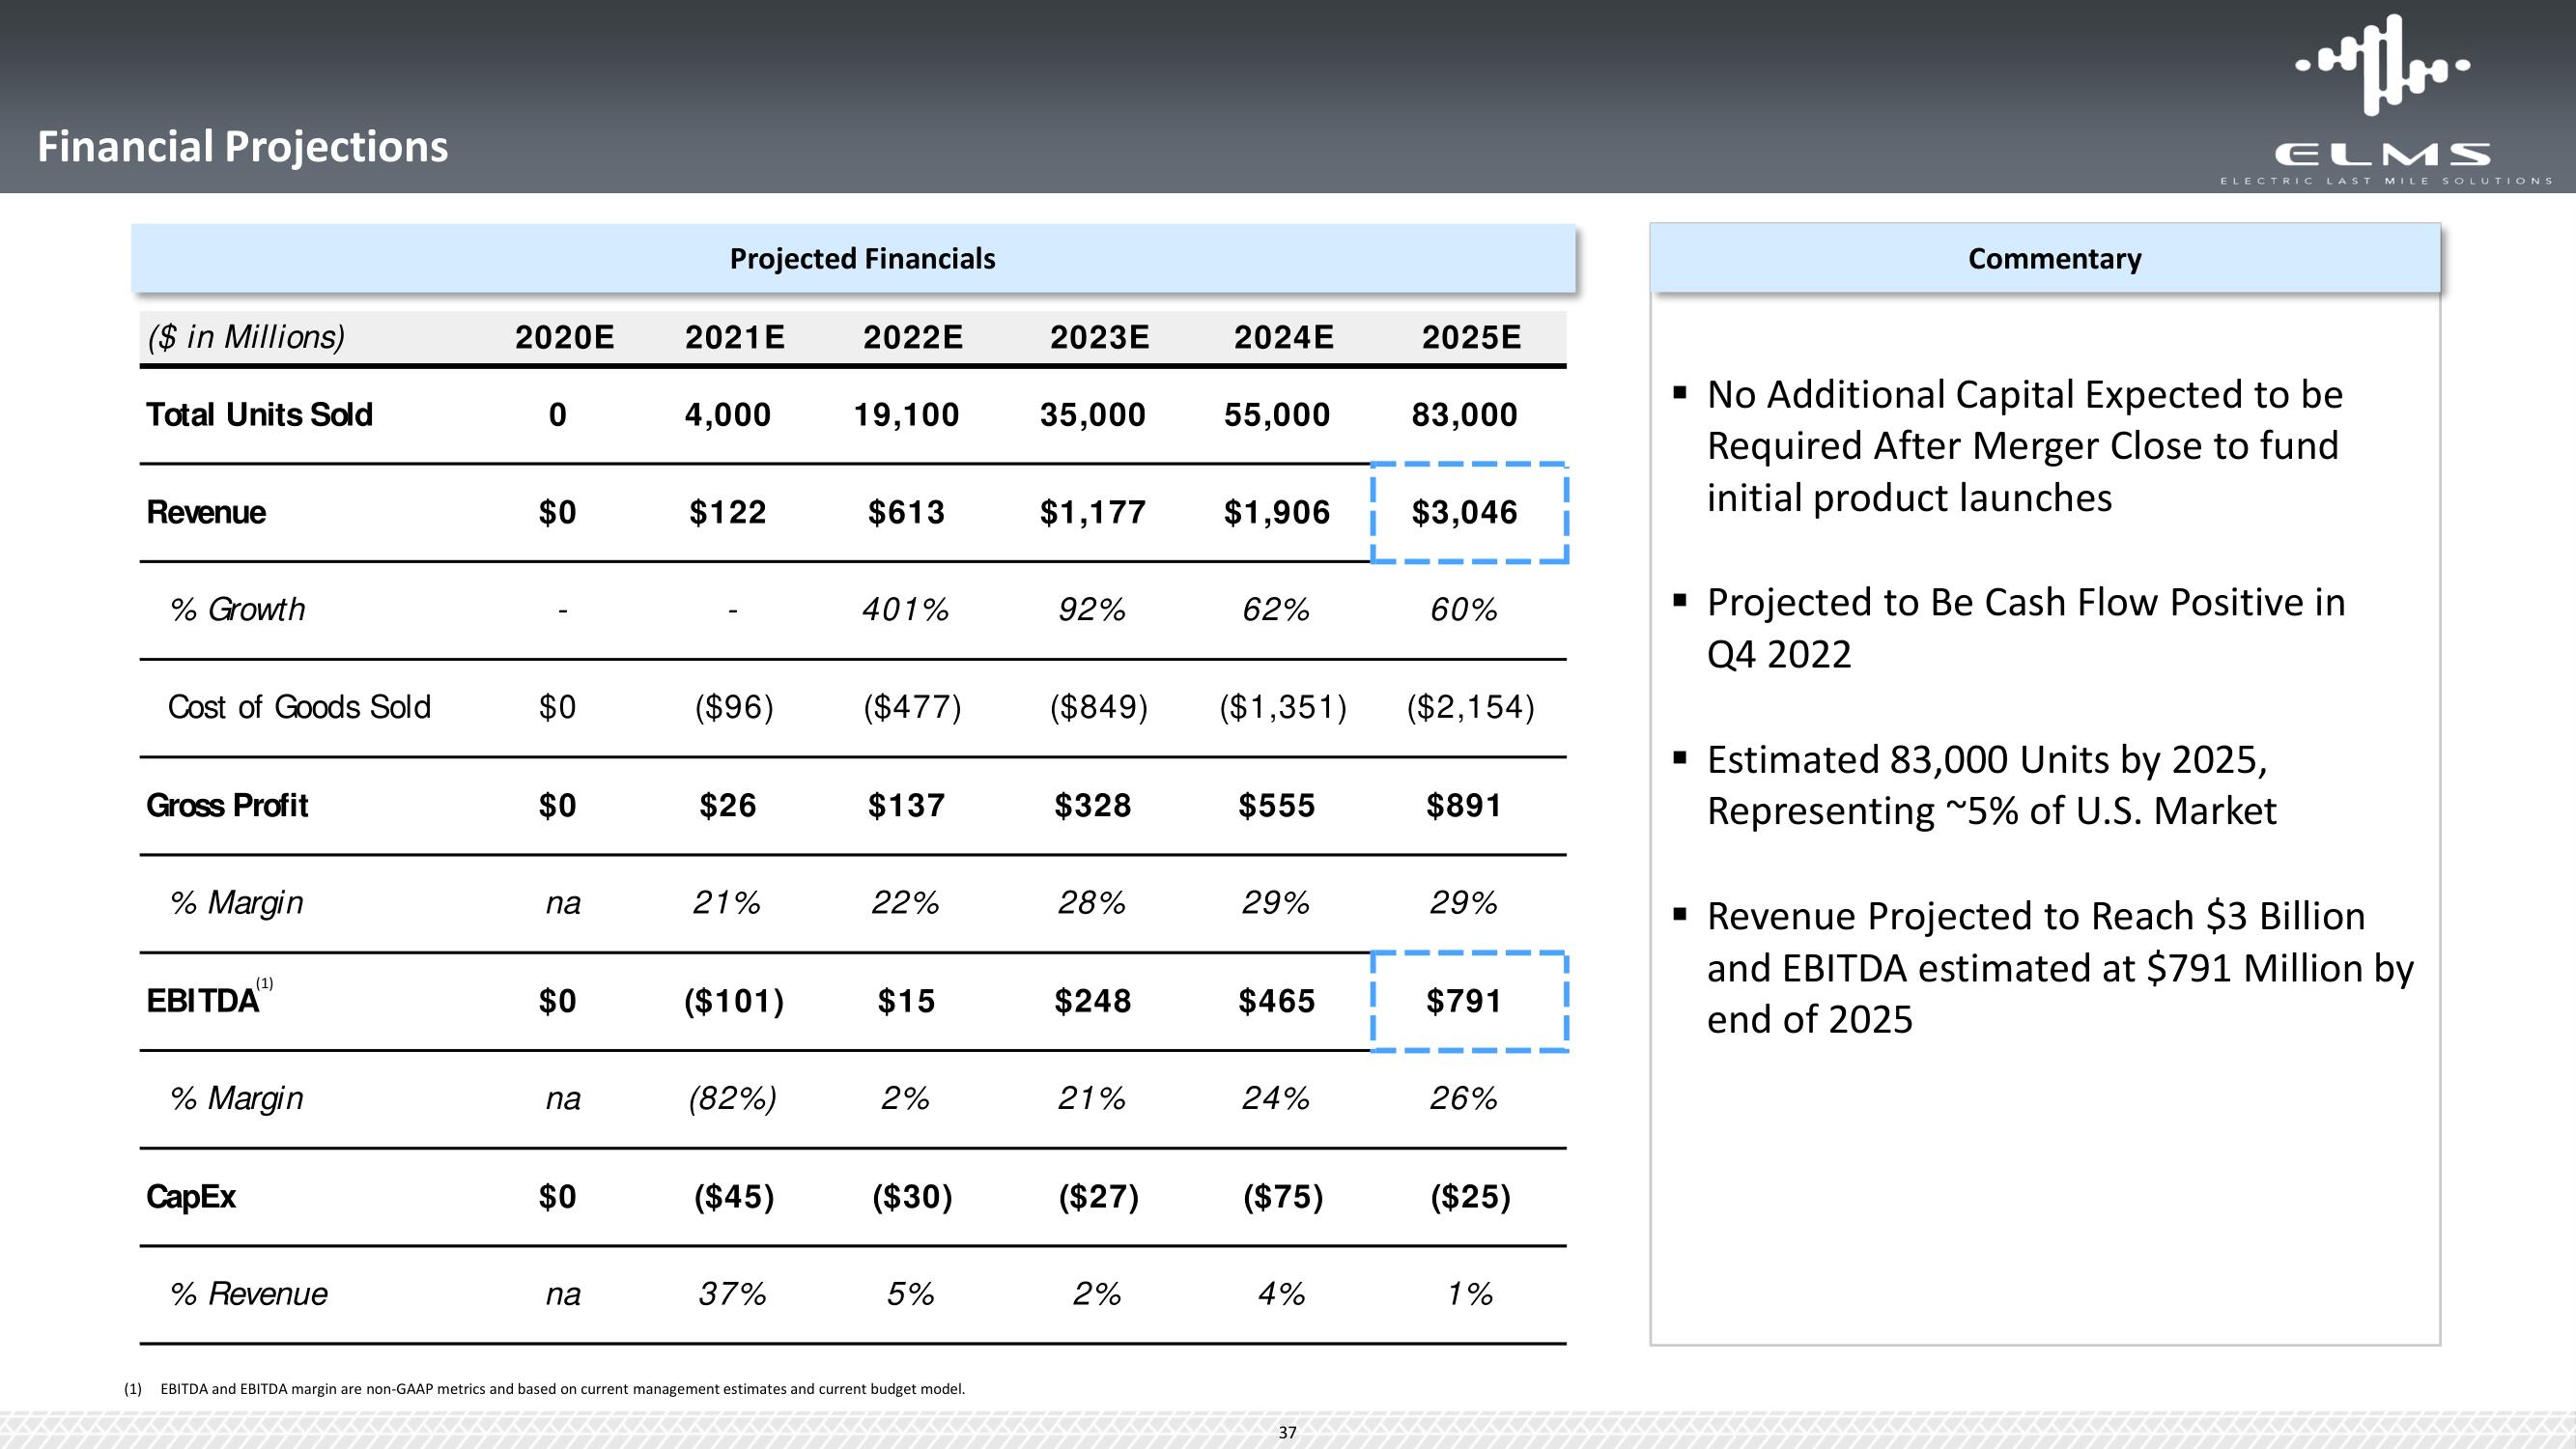
Financial Projections
(1)
($ in Millions)
Total Units Sold
Revenue
% Growth
Cost of Goods Sold
Gross Profit
% Margin
EBITDA¹
% Margin
CapEx
% Revenue
2020E
0
$0
$0
$0
na
$0
na
$0
na
Projected Financials
2021E
4,000
$122
($96)
$26
21%
($101)
(82%)
($45)
37%
2022E
19,100
$613
401%
$137
22%
$15
($477) ($849)
2%
($30)
5%
2023E
EBITDA and EBITDA margin are non-GAAP metrics and based on current management estimates and current budget model.
35,000 55,000
92%
$1,177 $1,906 $3,046
$328
28%
$248
21%
2024E
($27)
2%
62%
($1,351)
$555
29%
$465
24%
($75)
4%
2025E
37
83,000
60%
($2,154)
$891
29%
$791
26%
($25)
1%
Commentary
.....
ELMS
ELECTRIC LAST MILE SOLUTIONS
▪ No Additional Capital Expected to be
Required After Merger Close to fund
initial product launches
Projected to Be Cash Flow Positive in
Q4 2022
▪ Estimated 83,000 Units by 2025,
Representing ~5% of U.S. Market
▪ Revenue Projected to Reach $3 Billion
and EBITDA estimated at $791 Million by
end of 2025View entire presentation