Bird SPAC Presentation Deck
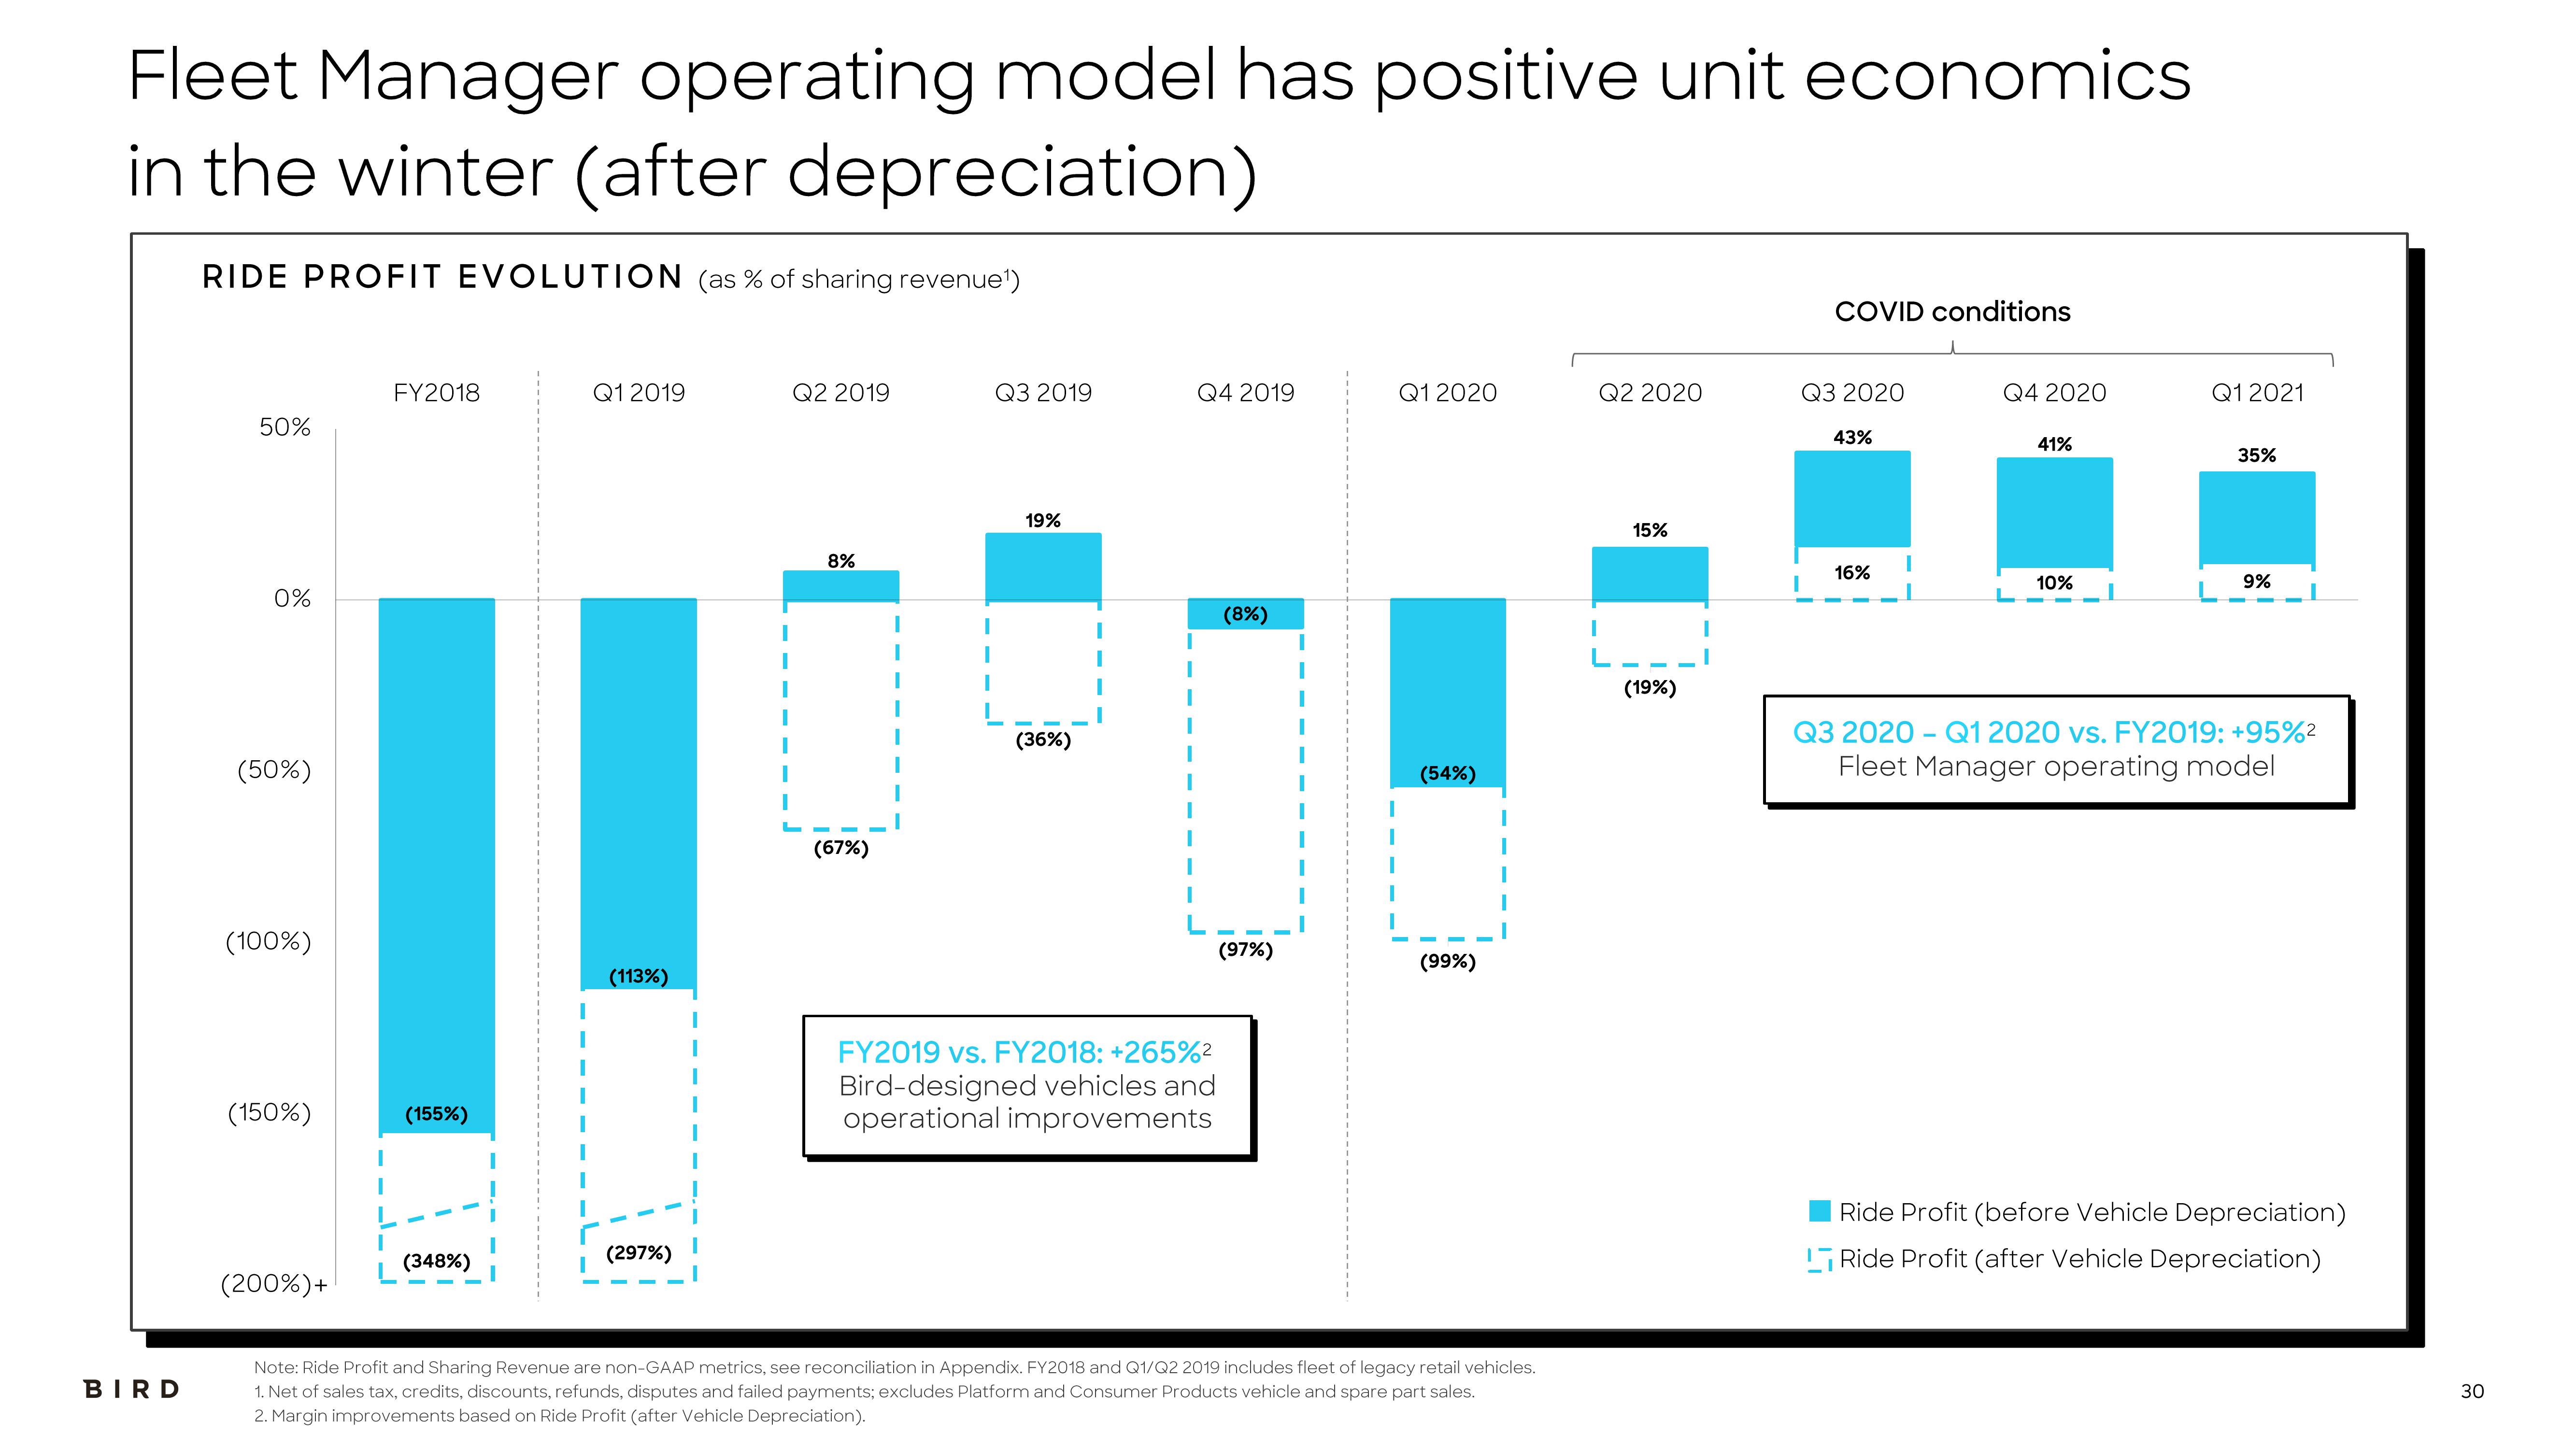
Fleet Manager operating model has positive unit economics
in the winter (after depreciation)
BIRD
RIDE PROFIT EVOLUTION (as % of sharing revenue¹)
50%
0%
(50%)
(100%)
(150%)
(200%) +
FY2018
(155%)
(348%)
Q1 2019
(113%)
(297%)
Q2 2019
8%
(67%)
Q3 2019
I
L
19%
(36%)
Q4 2019
FY2019 vs. FY2018: +265%²
Bird-designed vehicles and
operational improvements
(8%)
(97%)
Q1 2020
(54%)
(99%)
Note: Ride Profit and Sharing Revenue are non-GAAP metrics, see reconciliation in Appendix. FY2018 and Q1/Q2 2019 includes fleet of legacy retail vehicles.
1. Net of sales tax, credits, discounts, refunds, disputes and failed payments; excludes Platform and Consumer Products vehicle and spare part sales.
2. Margin improvements based on Ride Profit (after Vehicle Depreciation).
Q2 2020
I
15%
(19%)
COVID conditions
Q3 2020
43%
16%
Q4 2020
41%
10%
Q1 2021
35%
9%
Q3 2020-Q1 2020 vs. FY2019: +95%²
Fleet Manager operating model
Ride Profit (before Vehicle Depreciation)
Ride Profit (after Vehicle Depreciation)
30View entire presentation