Dave Results Presentation Deck
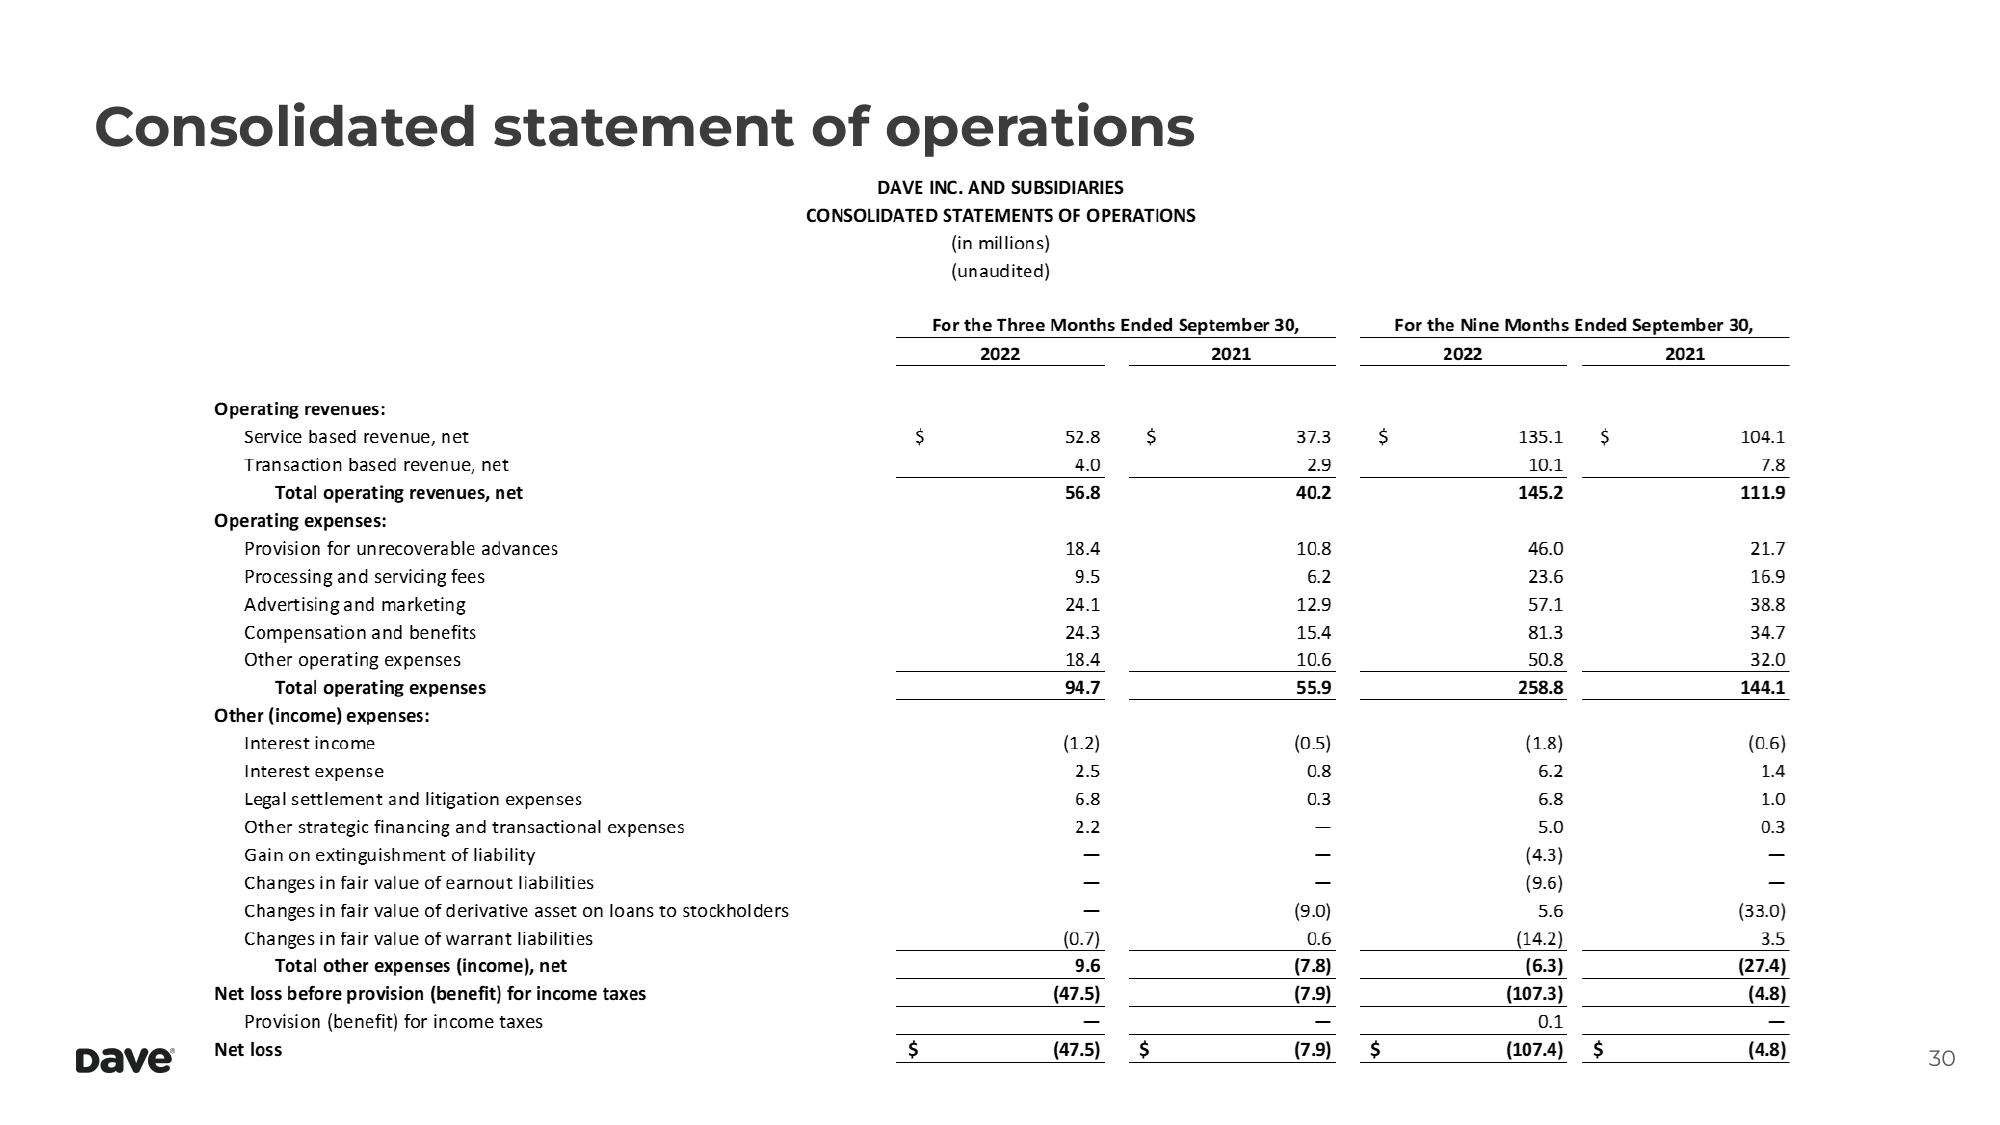
Consolidated statement of operations
DAVE INC. AND SUBSIDIARIES
CONSOLIDATED STATEMENTS OF OPERATIONS
(in millions)
(unaudited)
Dave
Operating revenues:
Service based revenue, net
Transaction based revenue, net
Total operating revenues, net
Operating expenses:
Provision for un recoverable advances
Processing and servicing fees
Advertising and marketing
Compensation and benefits
Other operating expenses
Total operating expenses
Other (income) expenses:
Interest income
Interest expense
Legal settlement and litigation expenses
Other strategic financing and transactional expenses
Gain on extinguishment of liability
Changes in fair value of earnout liabilities
Changes in fair value of derivative asset on loans to stockholders
Changes in fair value of warrant liabilities
Total other expenses (income), net
Net loss before provision (benefit) for income taxes
Provision (benefit) for income taxes
Net loss
$
$
For the Three Months Ended September 30,
2022
2021
52.8
4.0
56.8
18.4
9.5
24.1
24.3
18.4
94.7
(1.2)
2.5
6.8
2.2
(0.7)
9.6
(47.5)
(47.5)
$
$
37.3
2.9
40.2
10.8
6.2
12.9
15.4
10.6
55.9
(0.5)
0.8
0.3
(9.0)
0.6
(7.8)
(7.9)
(7.9)
$
$
For the Nine Months Ended September 30,
2022
2021
135.1
10.1
145.2
46.0
23.6
57.1
81.3
50.8
258.8
(1.8)
6.2
6.8
5.0
(4.3)
(9.6)
5.6
$
(14.2)
(6.3)
(107.3)
0.1
(107.4) $
104.1
7.8
111.9
21.7
16.9
38.8
34.7
32.0
144.1
(0.6)
1.4
1.0
0.3
(33.0)
3.5
(27.4)
(4.8)
(4.8)
30View entire presentation