CL King Best Ideas Conference
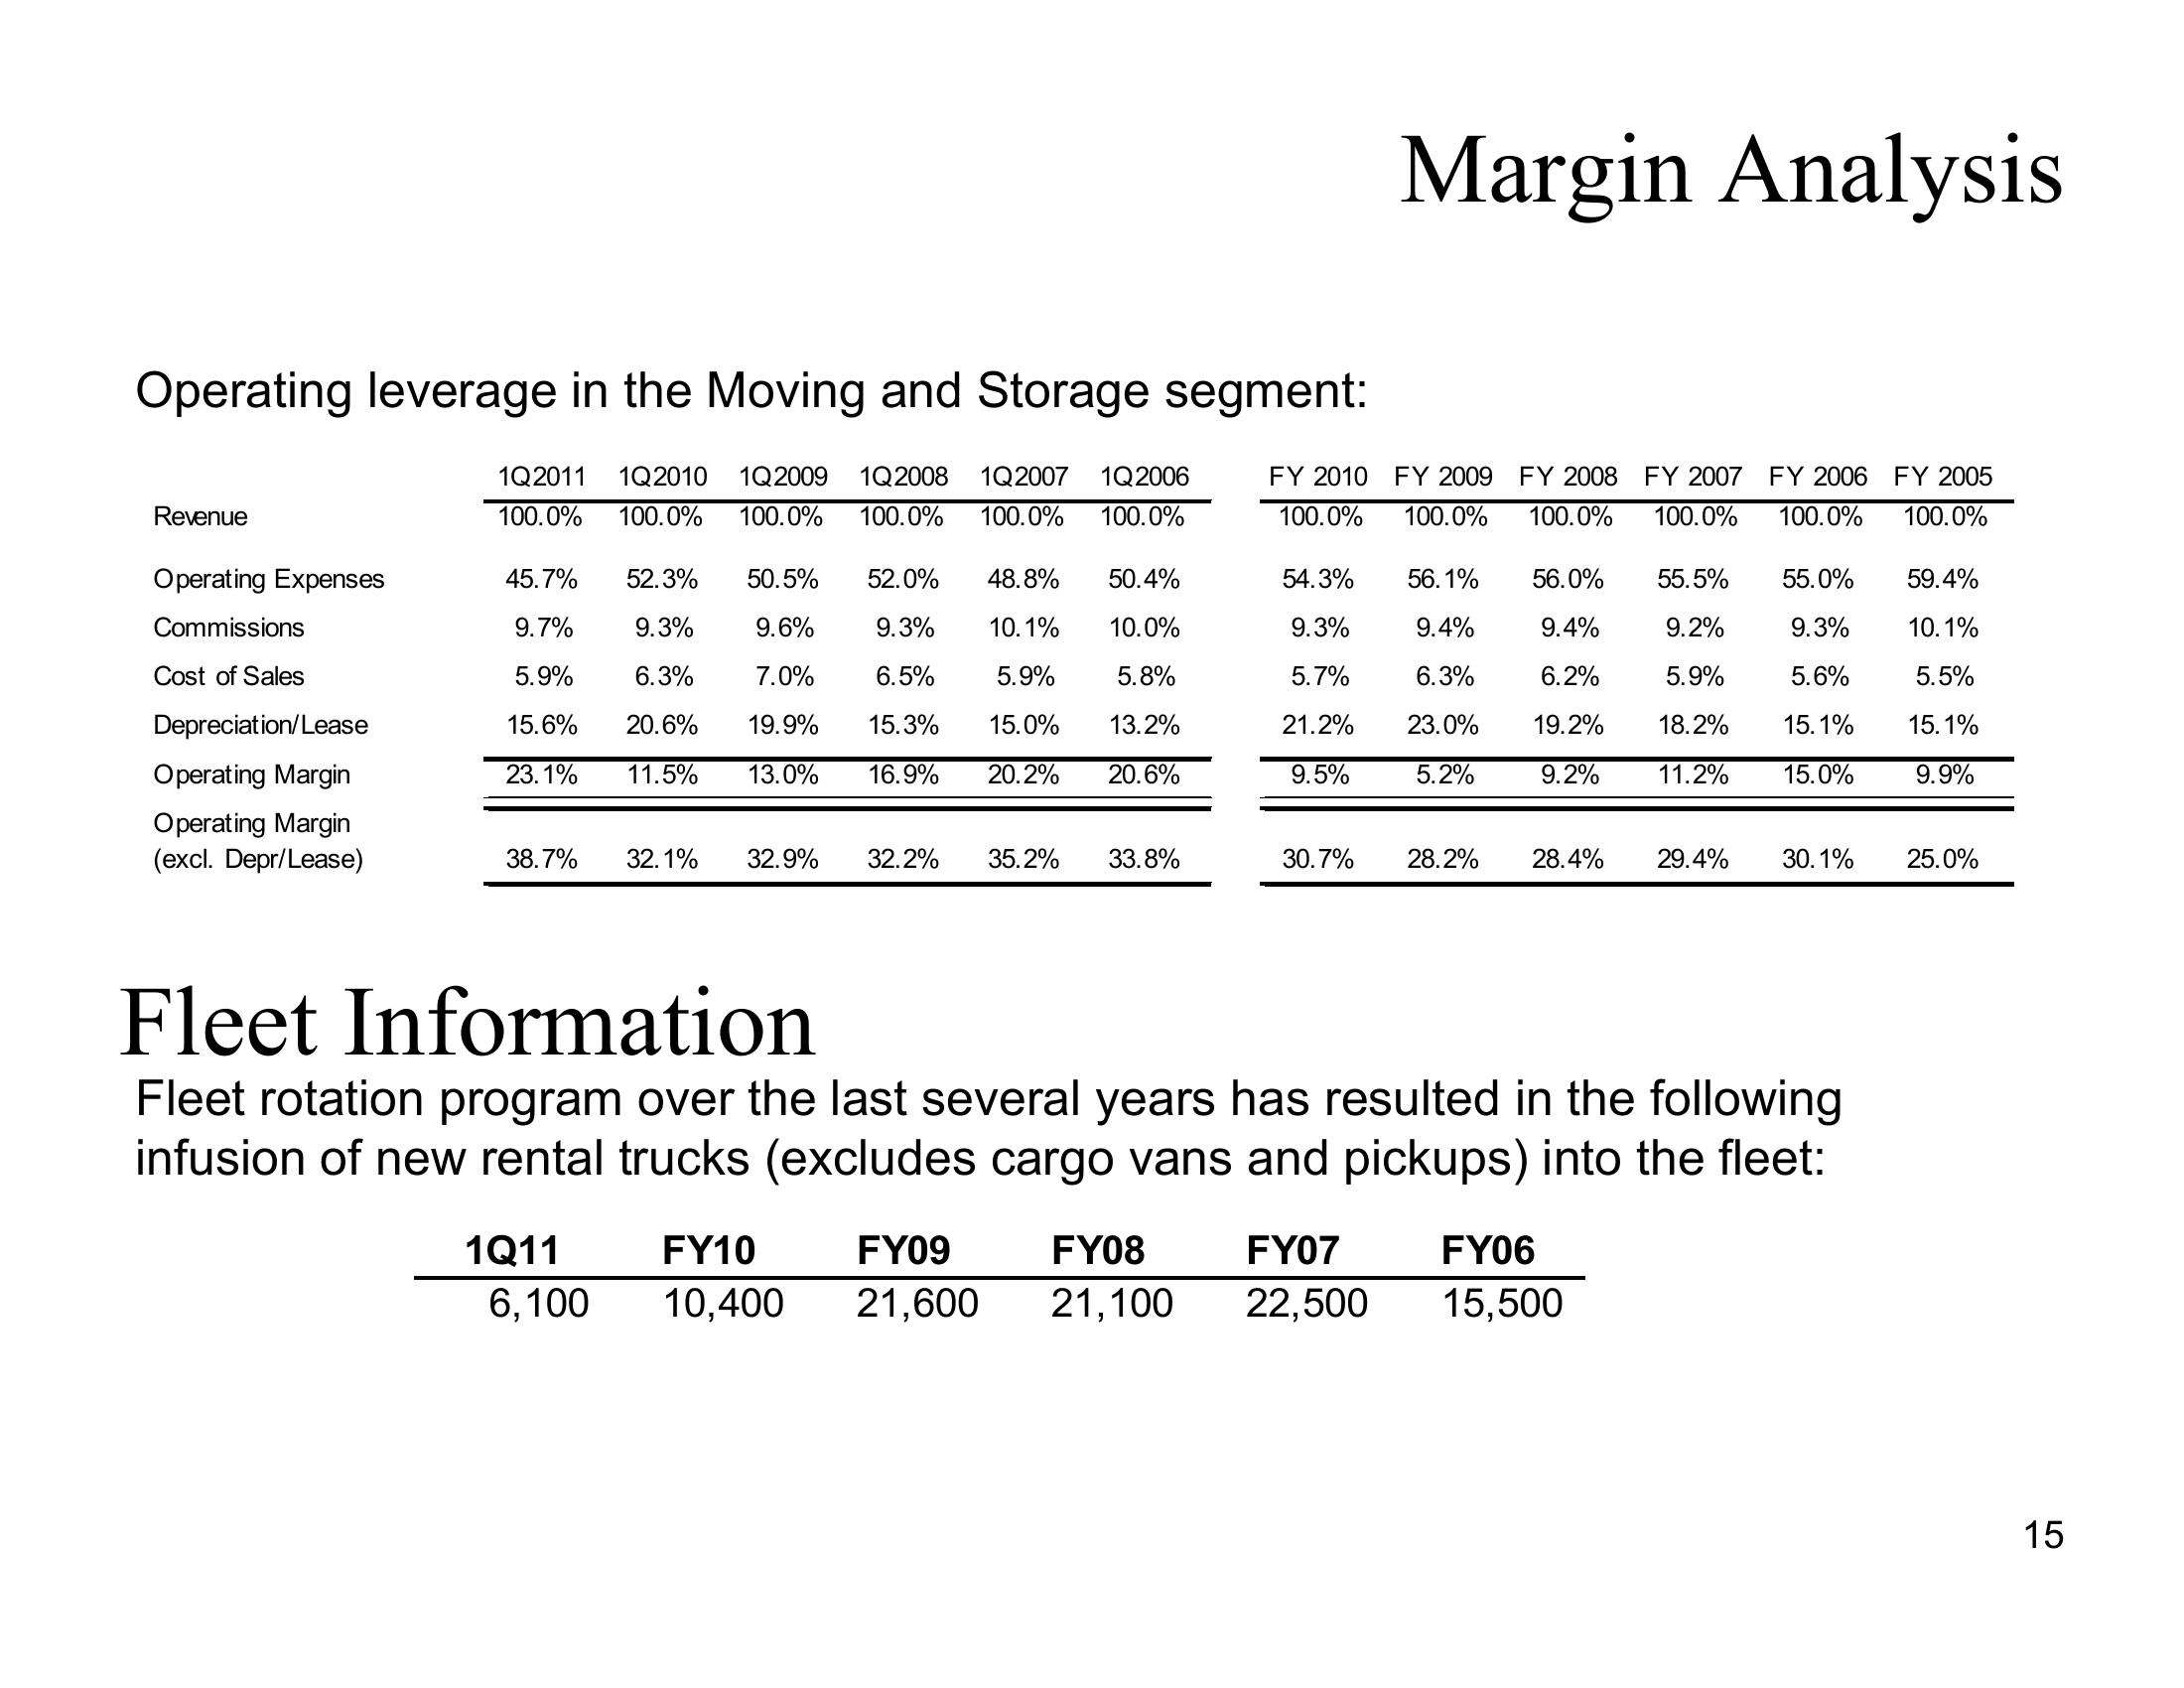
Margin Analysis
1Q2011 1Q2010 1Q2009 1Q2008 1Q2007 1Q2006
100.0% 100.0% 100.0% 100.0% 100.0% 100.0%
Operating leverage in the Moving and Storage segment:
Revenue
FY 2010 FY 2009 FY 2008 FY 2007 FY 2006 FY 2005
100.0% 100.0%
100.0%
100.0%
100.0%
100.0%
Operating Expenses
Commissions
Cost of Sales
Depreciation/Lease
45.7%
9.7%
5.9%
9.3%
52.3% 50.5% 52.0%
9.6% 9.3%
48.8% 50.4%
10.1% 10.0%
54.3%
56.1%
56.0% 55.5%
55.0%
59.4%
9.3%
9.4%
9.4%
9.2%
9.3%
10.1%
6.3%
7.0%
6.5%
5.9%
5.8%
5.7%
6.3%
6.2%
5.9%
5.6%
5.5%
Operating Margin
15.6% 20.6% 19.9% 15.3% 15.0% 13.2%
23.1% 11.5% 13.0% 16.9% 20.2% 20.6%
21.2%
9.5%
23.0% 19.2%
5.2% 9.2%
18.2%
15.1%
15.1%
11.2% 15.0%
9.9%
Operating Margin
(excl. Depr/Lease)
38.7%
32.1% 32.9% 32.2% 35.2% 33.8%
30.7%
28.2% 28.4% 29.4% 30.1%
25.0%
Fleet Information
Fleet rotation program over the last several years has resulted in the following
infusion of new rental trucks (excludes cargo vans and pickups) into the fleet:
1Q11
6,100
FY10
10,400
FY09
21,600
FY08 FY07
21,100 22,500
FY06
15,500
15View entire presentation