Bed Bath & Beyond Results Presentation Deck
FISCAL 2020 Q4 HIGHLIGHTS
Q4: third consecutive quarter of comparable sales & profit growth;
strong operating and financial performance
Consistently
Executing on
Transformation
Strategy
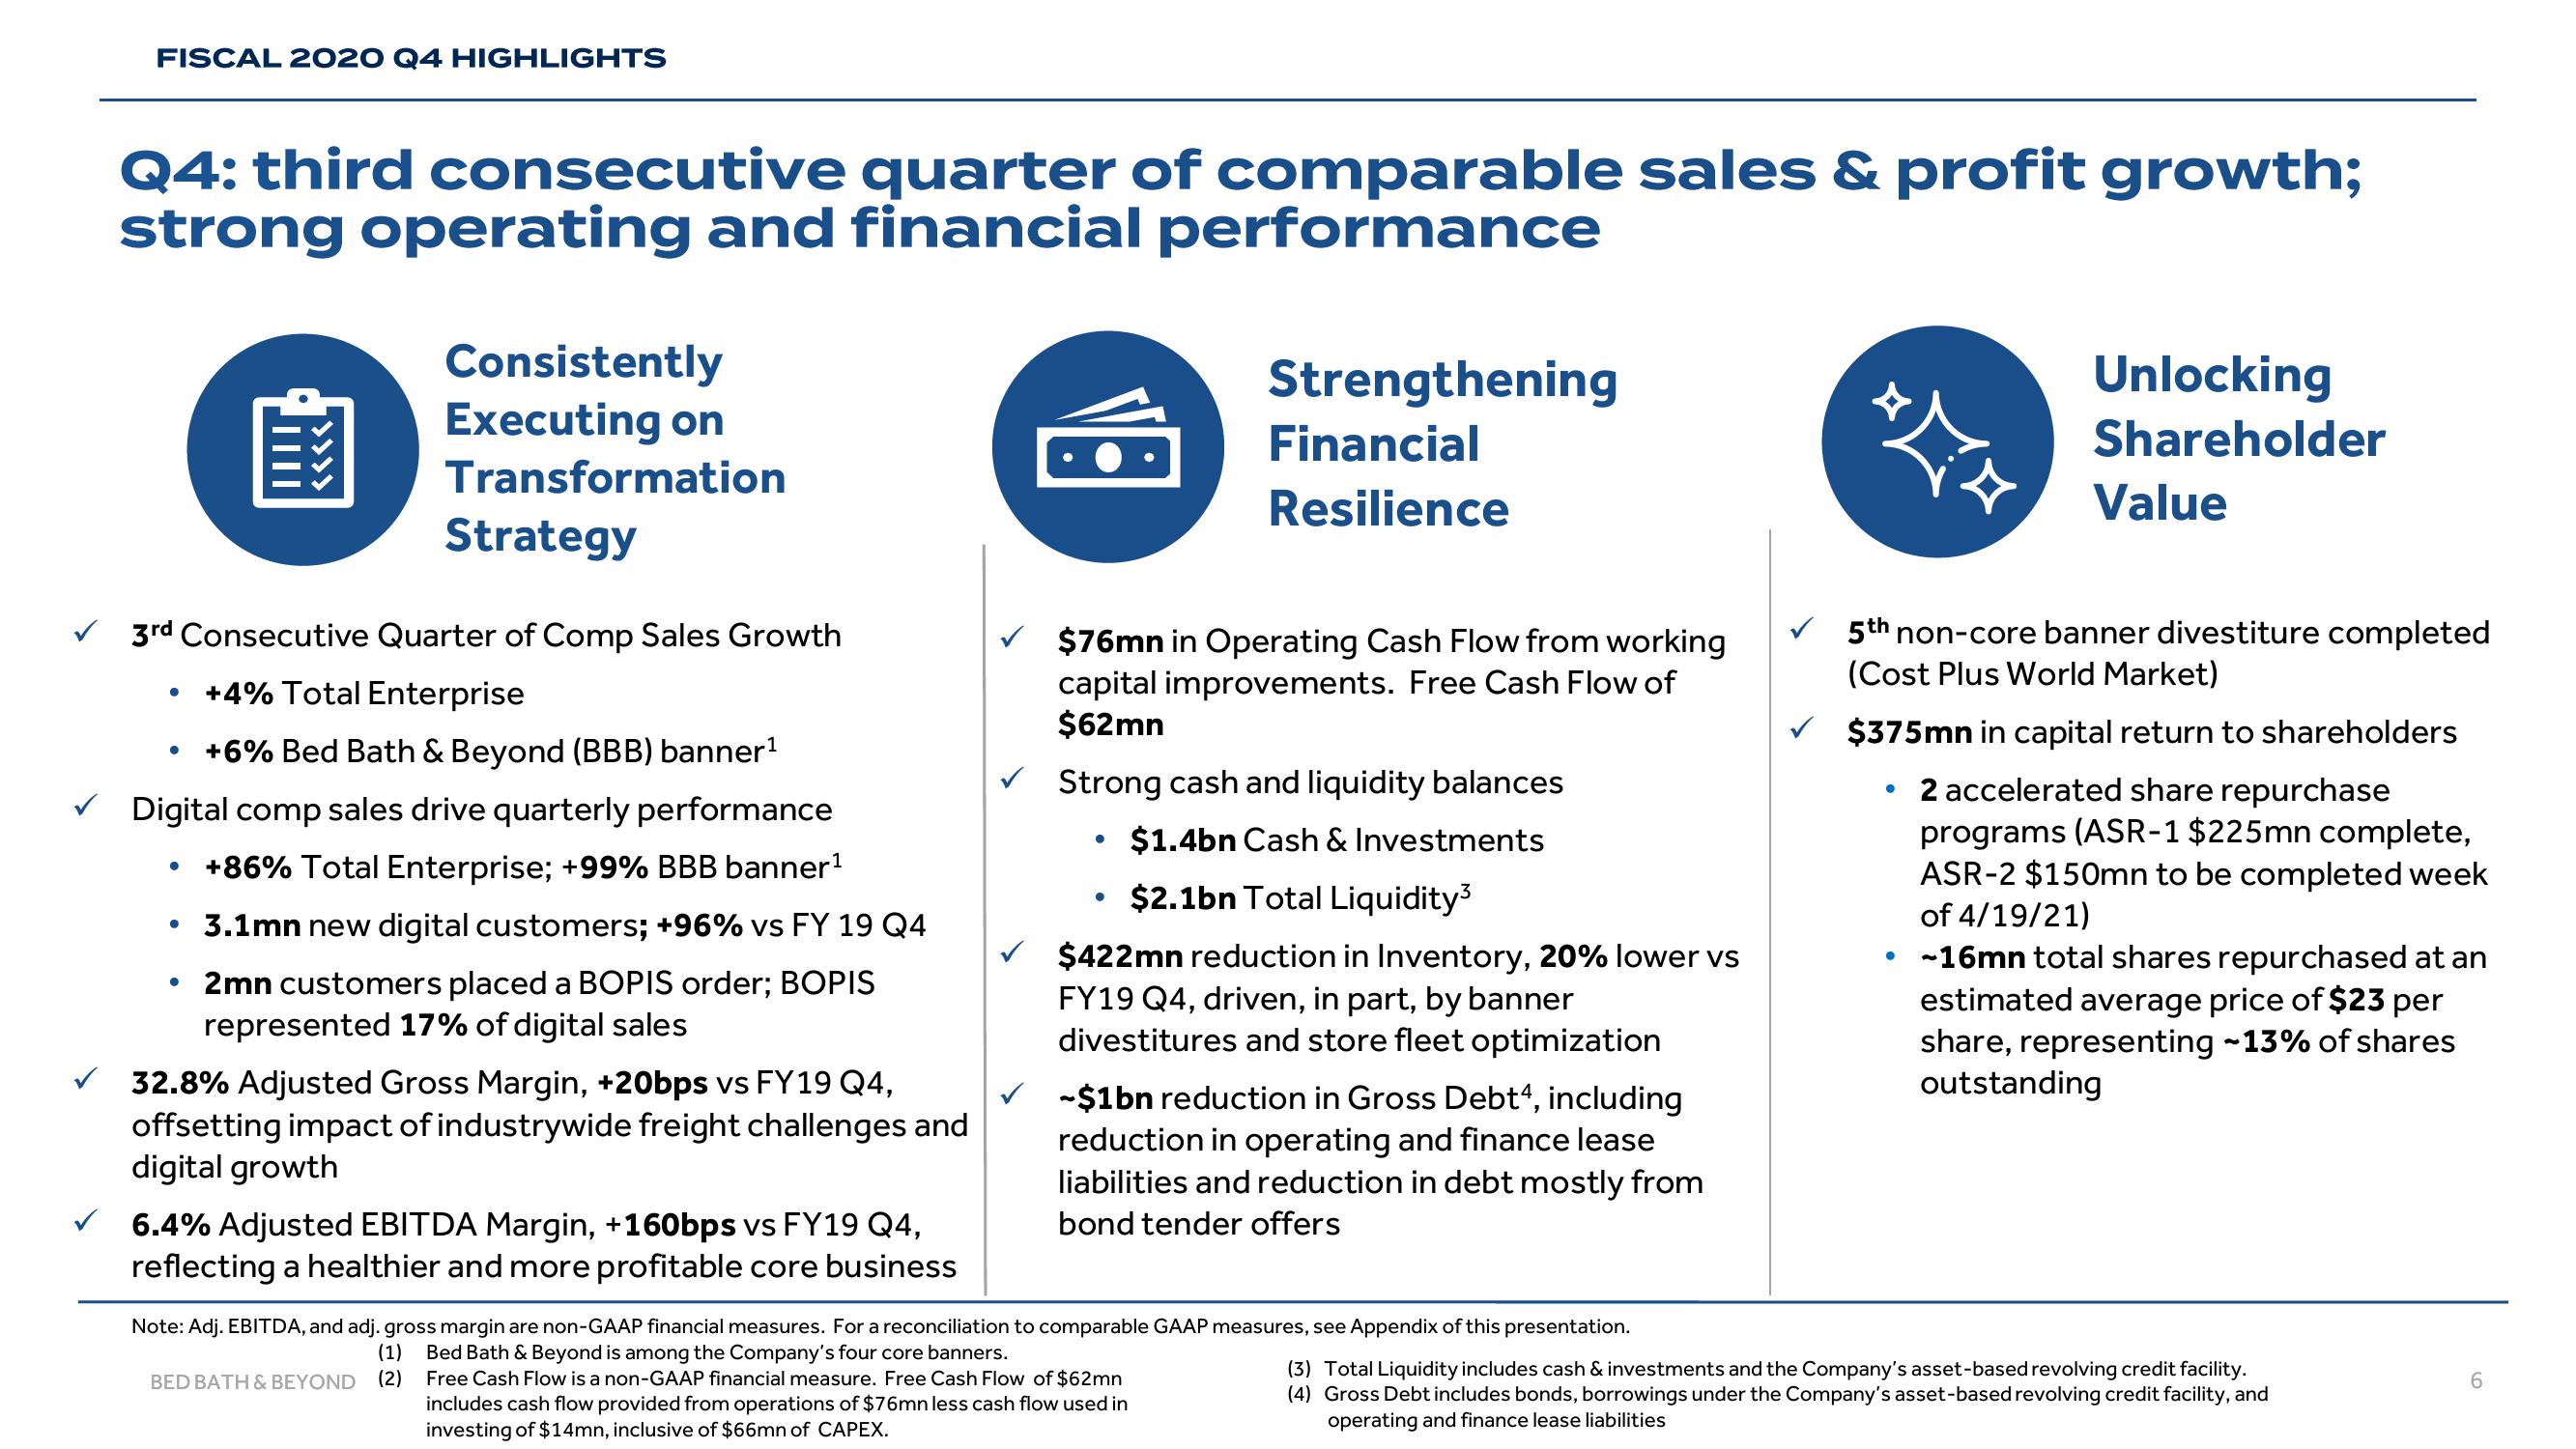
3rd Consecutive Quarter of Comp Sales Growth
+4% Total Enterprise
• +6% Bed Bath & Beyond (BBB) banner¹
Digital comp sales drive quarterly performance
• +86% Total Enterprise; +99% BBB banner¹
• 3.1mn new digital customers; +96% vs FY 19 Q4
2mn customers placed a BOPIS order; BOPIS
represented 17% of digital sales
●
32.8% Adjusted Gross Margin, +20bps vs FY 19 Q4,
offsetting impact of industrywide freight challenges and
digital growth
6.4% Adjusted EBITDA Margin, +160bps vs FY19 Q4,
reflecting a healthier and more profitable core business
$76mn in Operating Cash Flow from working
capital improvements. Free Cash Flow of
$62mn
Strong cash and liquidity balances
$1.4bn Cash & Investments
$2.1bn Total Liquidity³
●
Strengthening
Financial
Resilience
●
$422mn reduction in Inventory, 20% lower vs
FY19 Q4, driven, in part, by banner
divestitures and store fleet optimization
-$1bn reduction in Gross Debt4, including
reduction in operating and finance lease
liabilities and reduction in debt mostly from
bond tender offers
Note: Adj. EBITDA, and adj. gross margin are non-GAAP financial measures. For a reconciliation to comparable GAAP measures, see Appendix of this presentation.
(1) Bed Bath & Beyond is among the Company's four core banners.
BED BATH & BEYOND (2)
Free Cash Flow is a non-GAAP financial measure. Free Cash Flow of $62mn
includes cash flow provided from operations of $76mn less cash flow used in
investing of $14mn, inclusive of $66mn of CAPEX.
¤¯¤
Unlocking
Shareholder
Value
5th non-core banner divestiture completed
(Cost Plus World Market)
$375mn in capital return to shareholders
• 2 accelerated share repurchase
programs (ASR-1 $225mn complete,
ASR-2 $150mn to be completed week
of 4/19/21)
●
-16mn total shares repurchased at an
estimated average price of $23 per
share, representing -13% of shares
outstanding
(3) Total Liquidity includes cash & investments and the Company's asset-based revolving credit facility.
(4) Gross Debt includes bonds, borrowings under the Company's asset-based revolving credit facility, and
operating and finance lease liabilities
6View entire presentation