Imperial Brands Results Presentation Deck
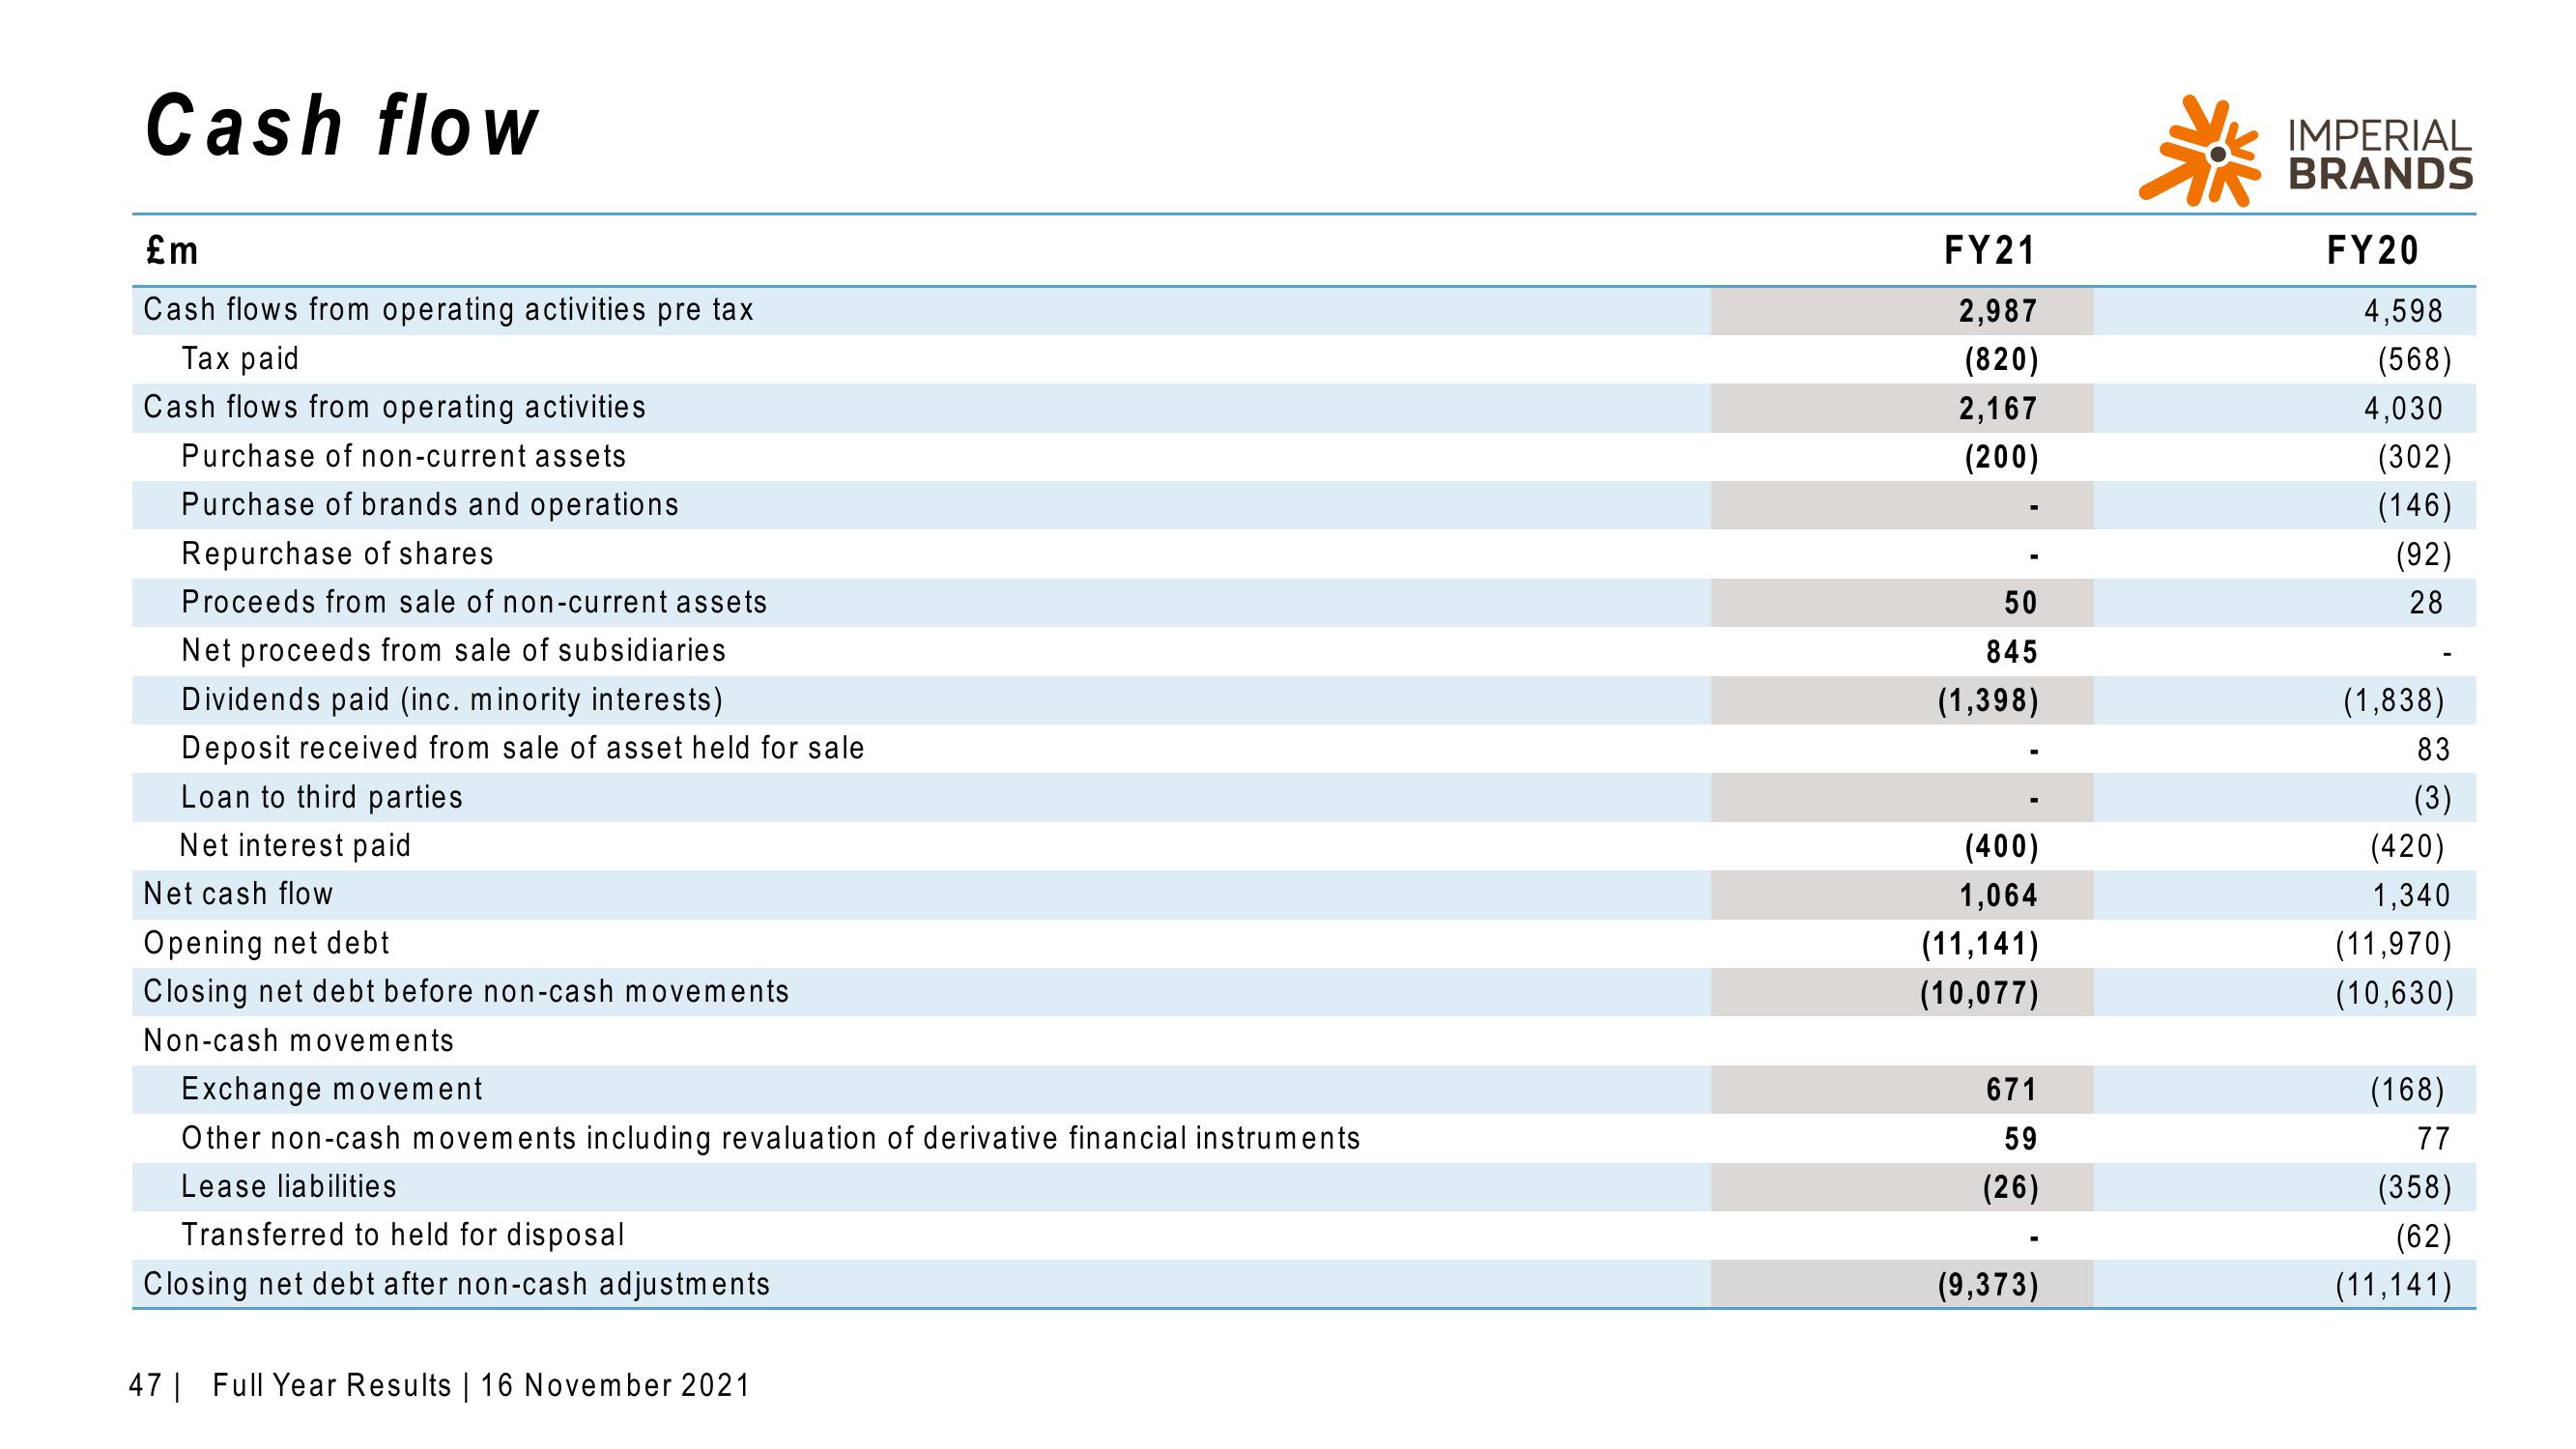
Cash flow
£m
Cash flows from operating activities pre tax
Tax paid
Cash flows from operating activities
Purchase of non-current assets
Purchase of brands and operations
Repurchase of shares
Proceeds from sale of non-current assets
Net proceeds from sale of subsidiaries
Dividends paid (inc. minority interests)
Deposit received from sale of asset held for sale
Loan to third parties
Net interest paid
Net cash flow
Opening net debt
Closing net debt before non-cash movements
Non-cash movements
Exchange movement
Other non-cash movements including revaluation of derivative financial instruments
Lease liabilities
Transferred to held for disposal
Closing net debt after non-cash adjustments
47 | Full Year Results | 16 November 2021
FY21
2,987
(820)
2,167
(200)
50
845
(1,398)
(400)
1,064
(11,141)
(10,077)
671
59
(26)
(9,373)
IMPERIAL
BRANDS
FY20
4,598
(568)
4,030
(302)
(146)
(92)
28
(1,838)
83
(3)
(420)
1,340
(11,970)
(10,630)
(168)
77
(358)
(62)
(11,141)View entire presentation