Investor Presentation
1Q23 Results
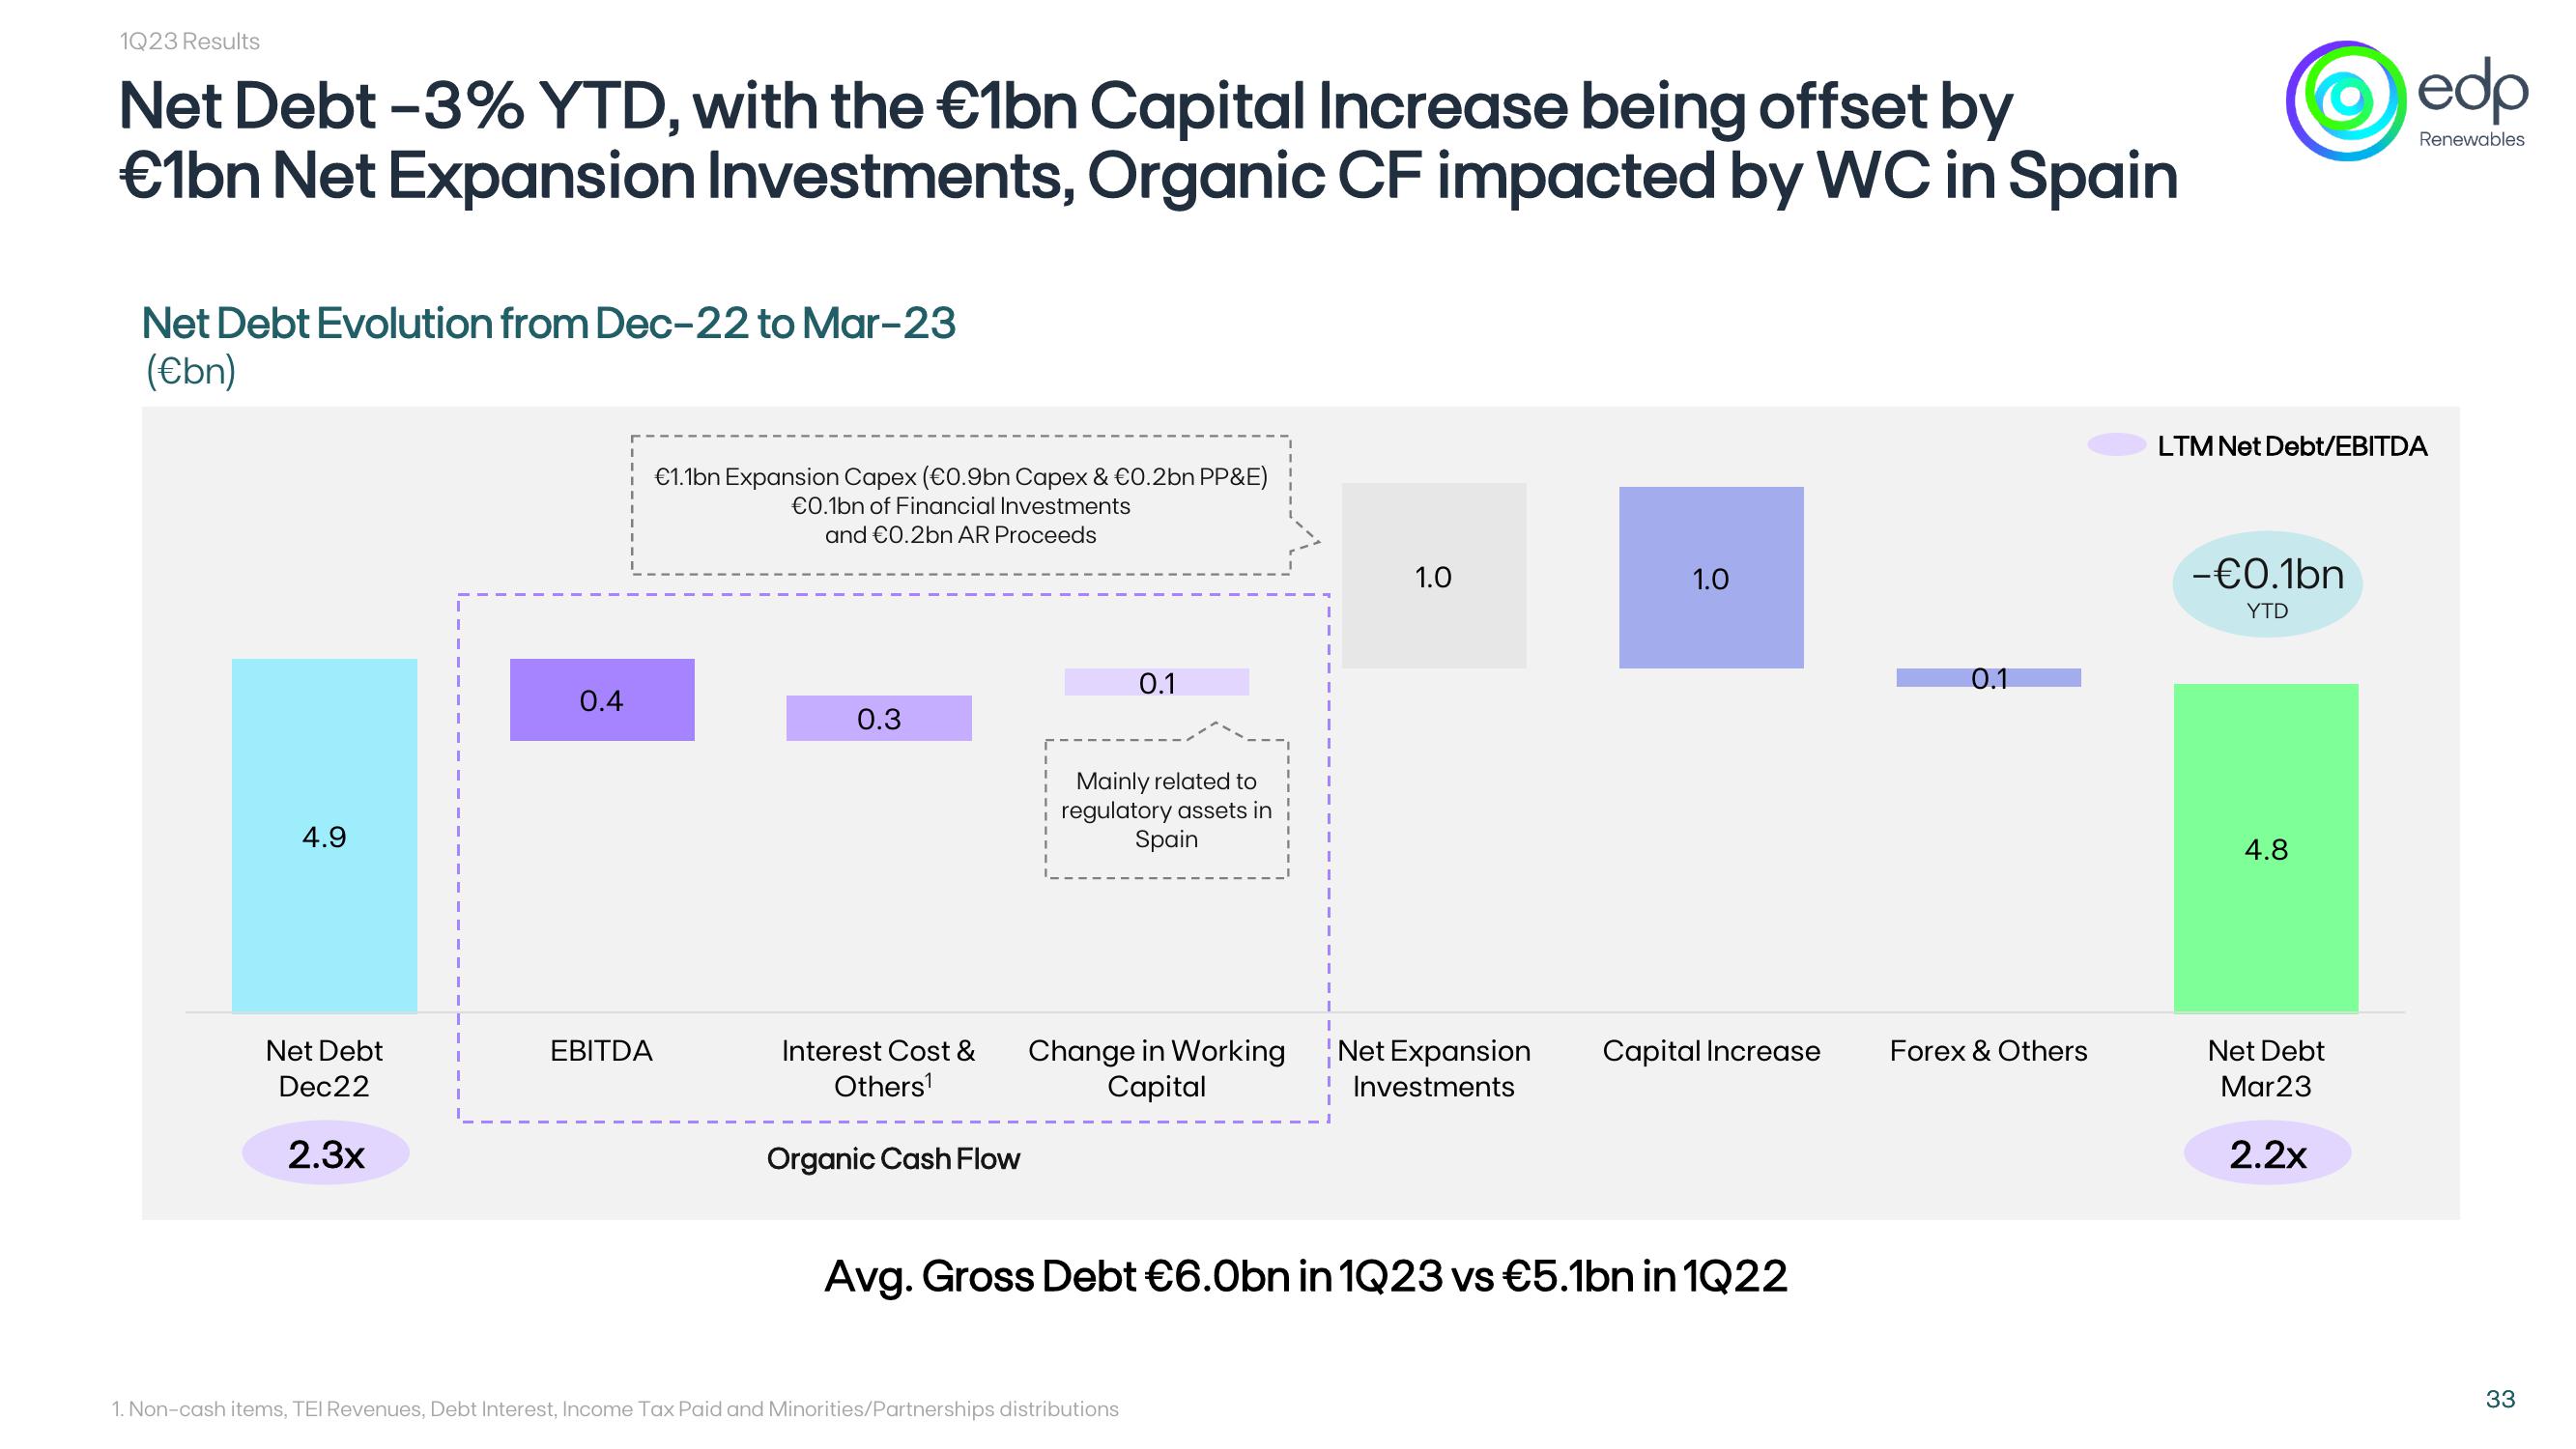
Net Debt -3% YTD, with the €1bn Capital Increase being offset by
€1bn Net Expansion Investments, Organic CF impacted by WC in Spain
edp
Renewables
Net Debt Evolution from Dec-22 to Mar-23
(€bn)
4.9
€1.1bn Expansion Capex (€0.9bn Capex & €0.2bn PP&E)
€0.1bn of Financial Investments
and €0.2bn AR Proceeds
0.4
0.3
0.1
Mainly related to
regulatory assets in
Spain
1.0
10
1.0
0.1
Net Debt
Dec22
EBITDA
Interest Cost &
Others¹
Change in Working
Capital
Net Expansion
Investments
Capital Increase
Forex & Others
2.3x
Organic Cash Flow
Avg. Gross Debt €6.0bn in 1Q23 vs €5.1bn in 1Q22
1. Non-cash items, TEI Revenues, Debt Interest, Income Tax Paid and Minorities/Partnerships distributions
LTM Net Debt/EBITDA
-€0.1bn
YTD
4.8
Net Debt
Mar 23
2.2x
33View entire presentation