Uber Results Presentation Deck
Mobility Highlights
$ in Millions
Gross
Bookings
% Constant Currency
Growth YoY
Adjusted Net
Revenue
% Constant Currency
Growth YoY
Adjusted
EBITDA
Uber
Q3 2020 Earnings
$12,554
22%
22.8%
O
$2,868
24%
22.0%
$631
Q3 2019
$13,512
20%
22.5%
$3,036
32%
24.4%
$742
Q4 2019
$10,874
(3%)
22.8%
$2,475
6%
23.5%
$581
Q1 2020
$3,046
(73%)
26.0%
$793
(68%)*
6.3%
$50
Q2 2020
$5,905
(50%)
23.1%
$1,365
(51%)
17.9%
$245
Q3 2020
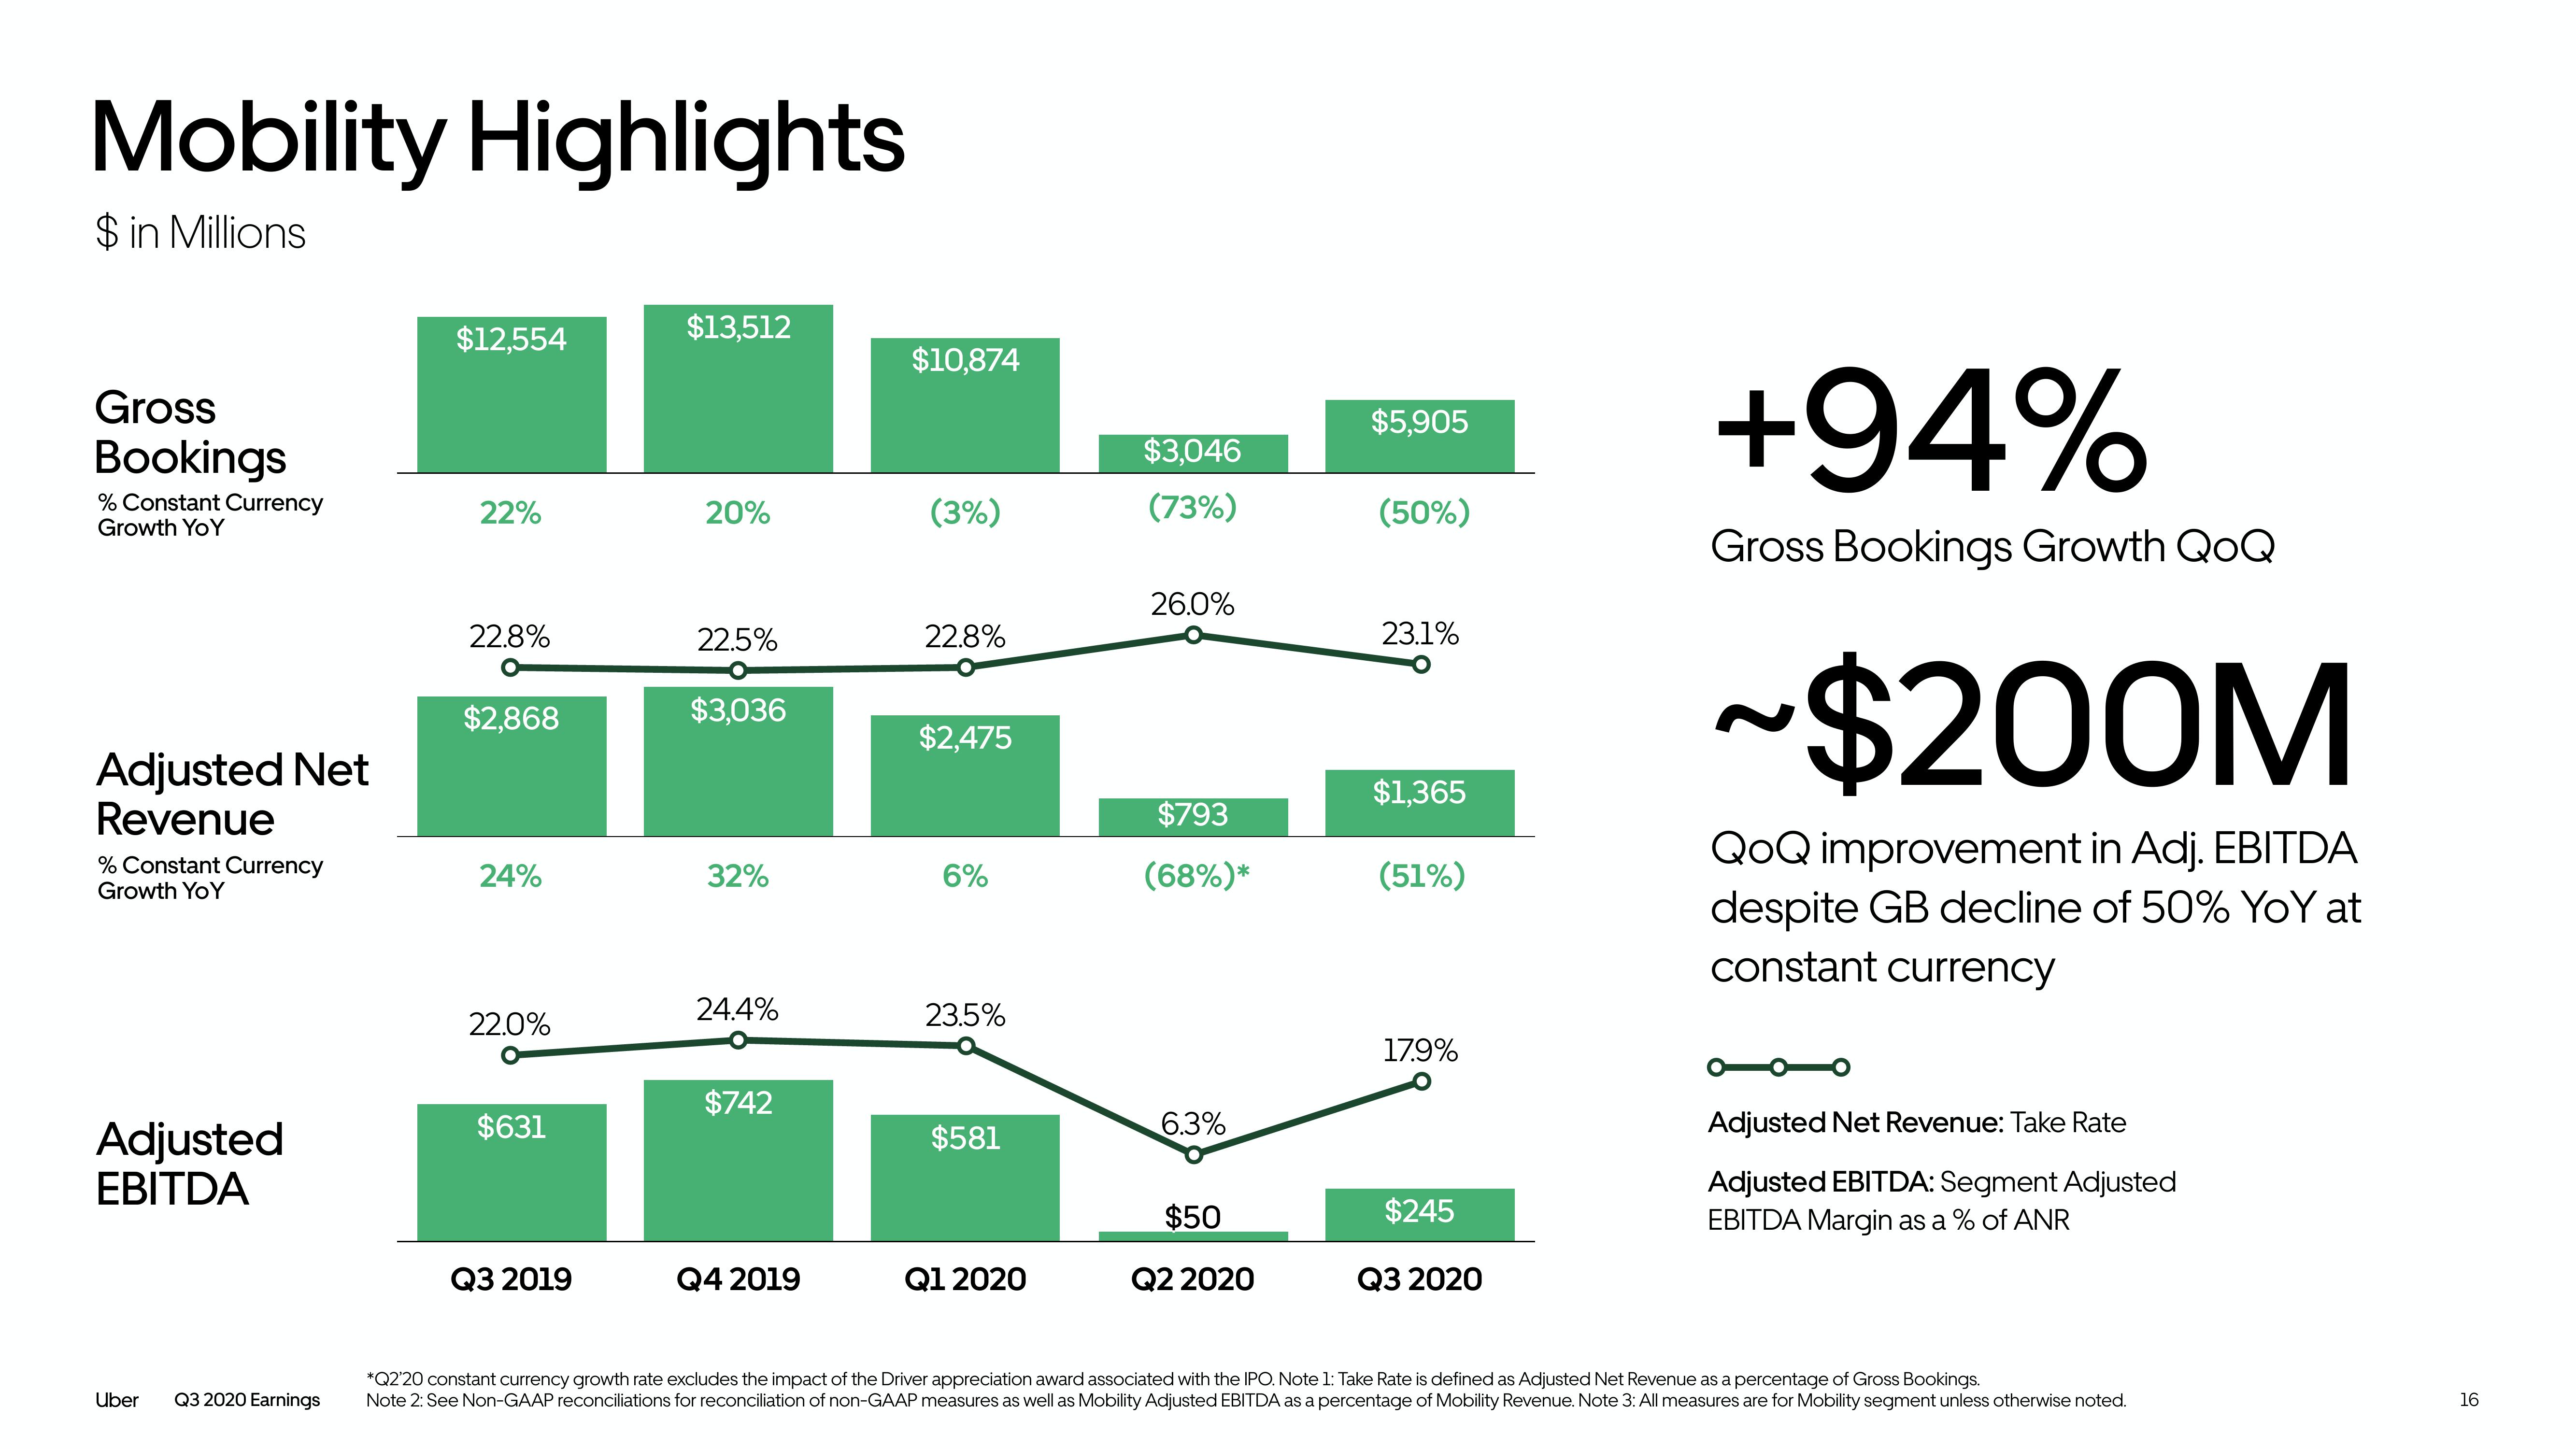
+94%
Gross Bookings Growth QoQ
~$200M
QoQ improvement in Adj. EBITDA
despite GB decline of 50% YoY at
constant currency
Adjusted Net Revenue: Take Rate
Adjusted EBITDA: Segment Adjusted
EBITDA Margin as a % of ANR
*Q2'20 constant currency growth rate excludes the impact of the Driver appreciation award associated with the IPO. Note 1: Take Rate is defined as Adjusted Net Revenue as a percentage of Gross Bookings.
Note 2: See Non-GAAP reconciliations for reconciliation of non-GAAP measures as well as Mobility Adjusted EBITDA as a percentage of Mobility Revenue. Note 3: All measures are for Mobility segment unless otherwise noted.
16View entire presentation