WeWork SPAC Presentation Deck
Financial highlights
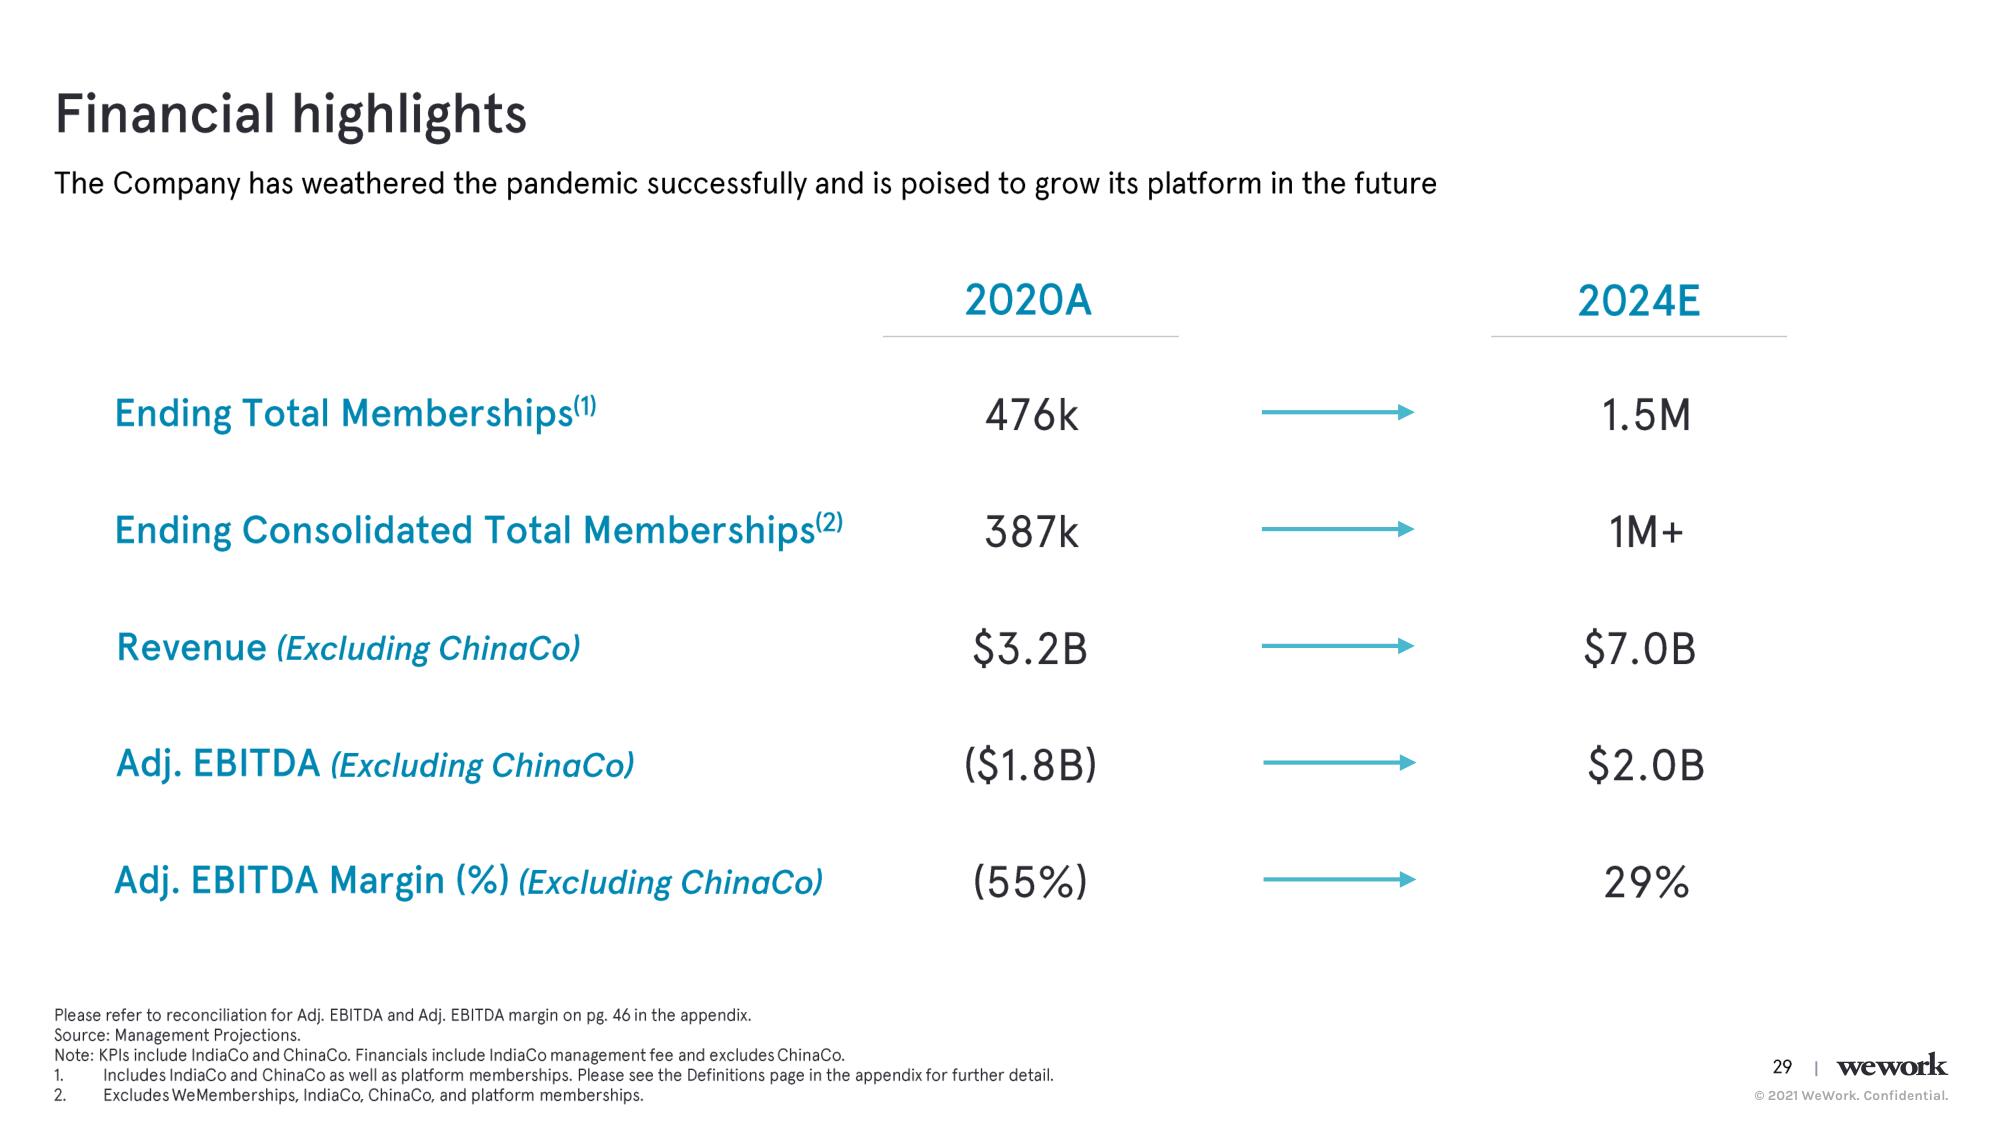
The Company has weathered the pandemic successfully and is poised to grow its platform in the future
Ending Total Memberships(1)
1.
2.
Ending Consolidated Total Memberships(2)
Revenue (Excluding ChinaCo)
Adj. EBITDA (Excluding ChinaCo)
Adj. EBITDA Margin (%) (Excluding ChinaCo)
2020A
476k
387k
$3.2B
($1.8B)
(55%)
Please refer to reconciliation for Adj. EBITDA and Adj. EBITDA margin on pg. 46 in the appendix.
Source: Management Projections.
Note: KPIs include IndiaCo and ChinaCo. Financials include IndiaCo management fee and excludes ChinaCo.
Includes IndiaCo and ChinaCo as well as platform memberships. Please see the Definitions page in the appendix for further detail.
Excludes We Memberships, IndiaCo, ChinaCo, and platform memberships.
2024E
1.5M
1M+
$7.0B
$2.0B
29%
29 | wework
Ⓒ2021 WeWork. Confidential.View entire presentation