Maersk Investor Presentation Deck
Key statements
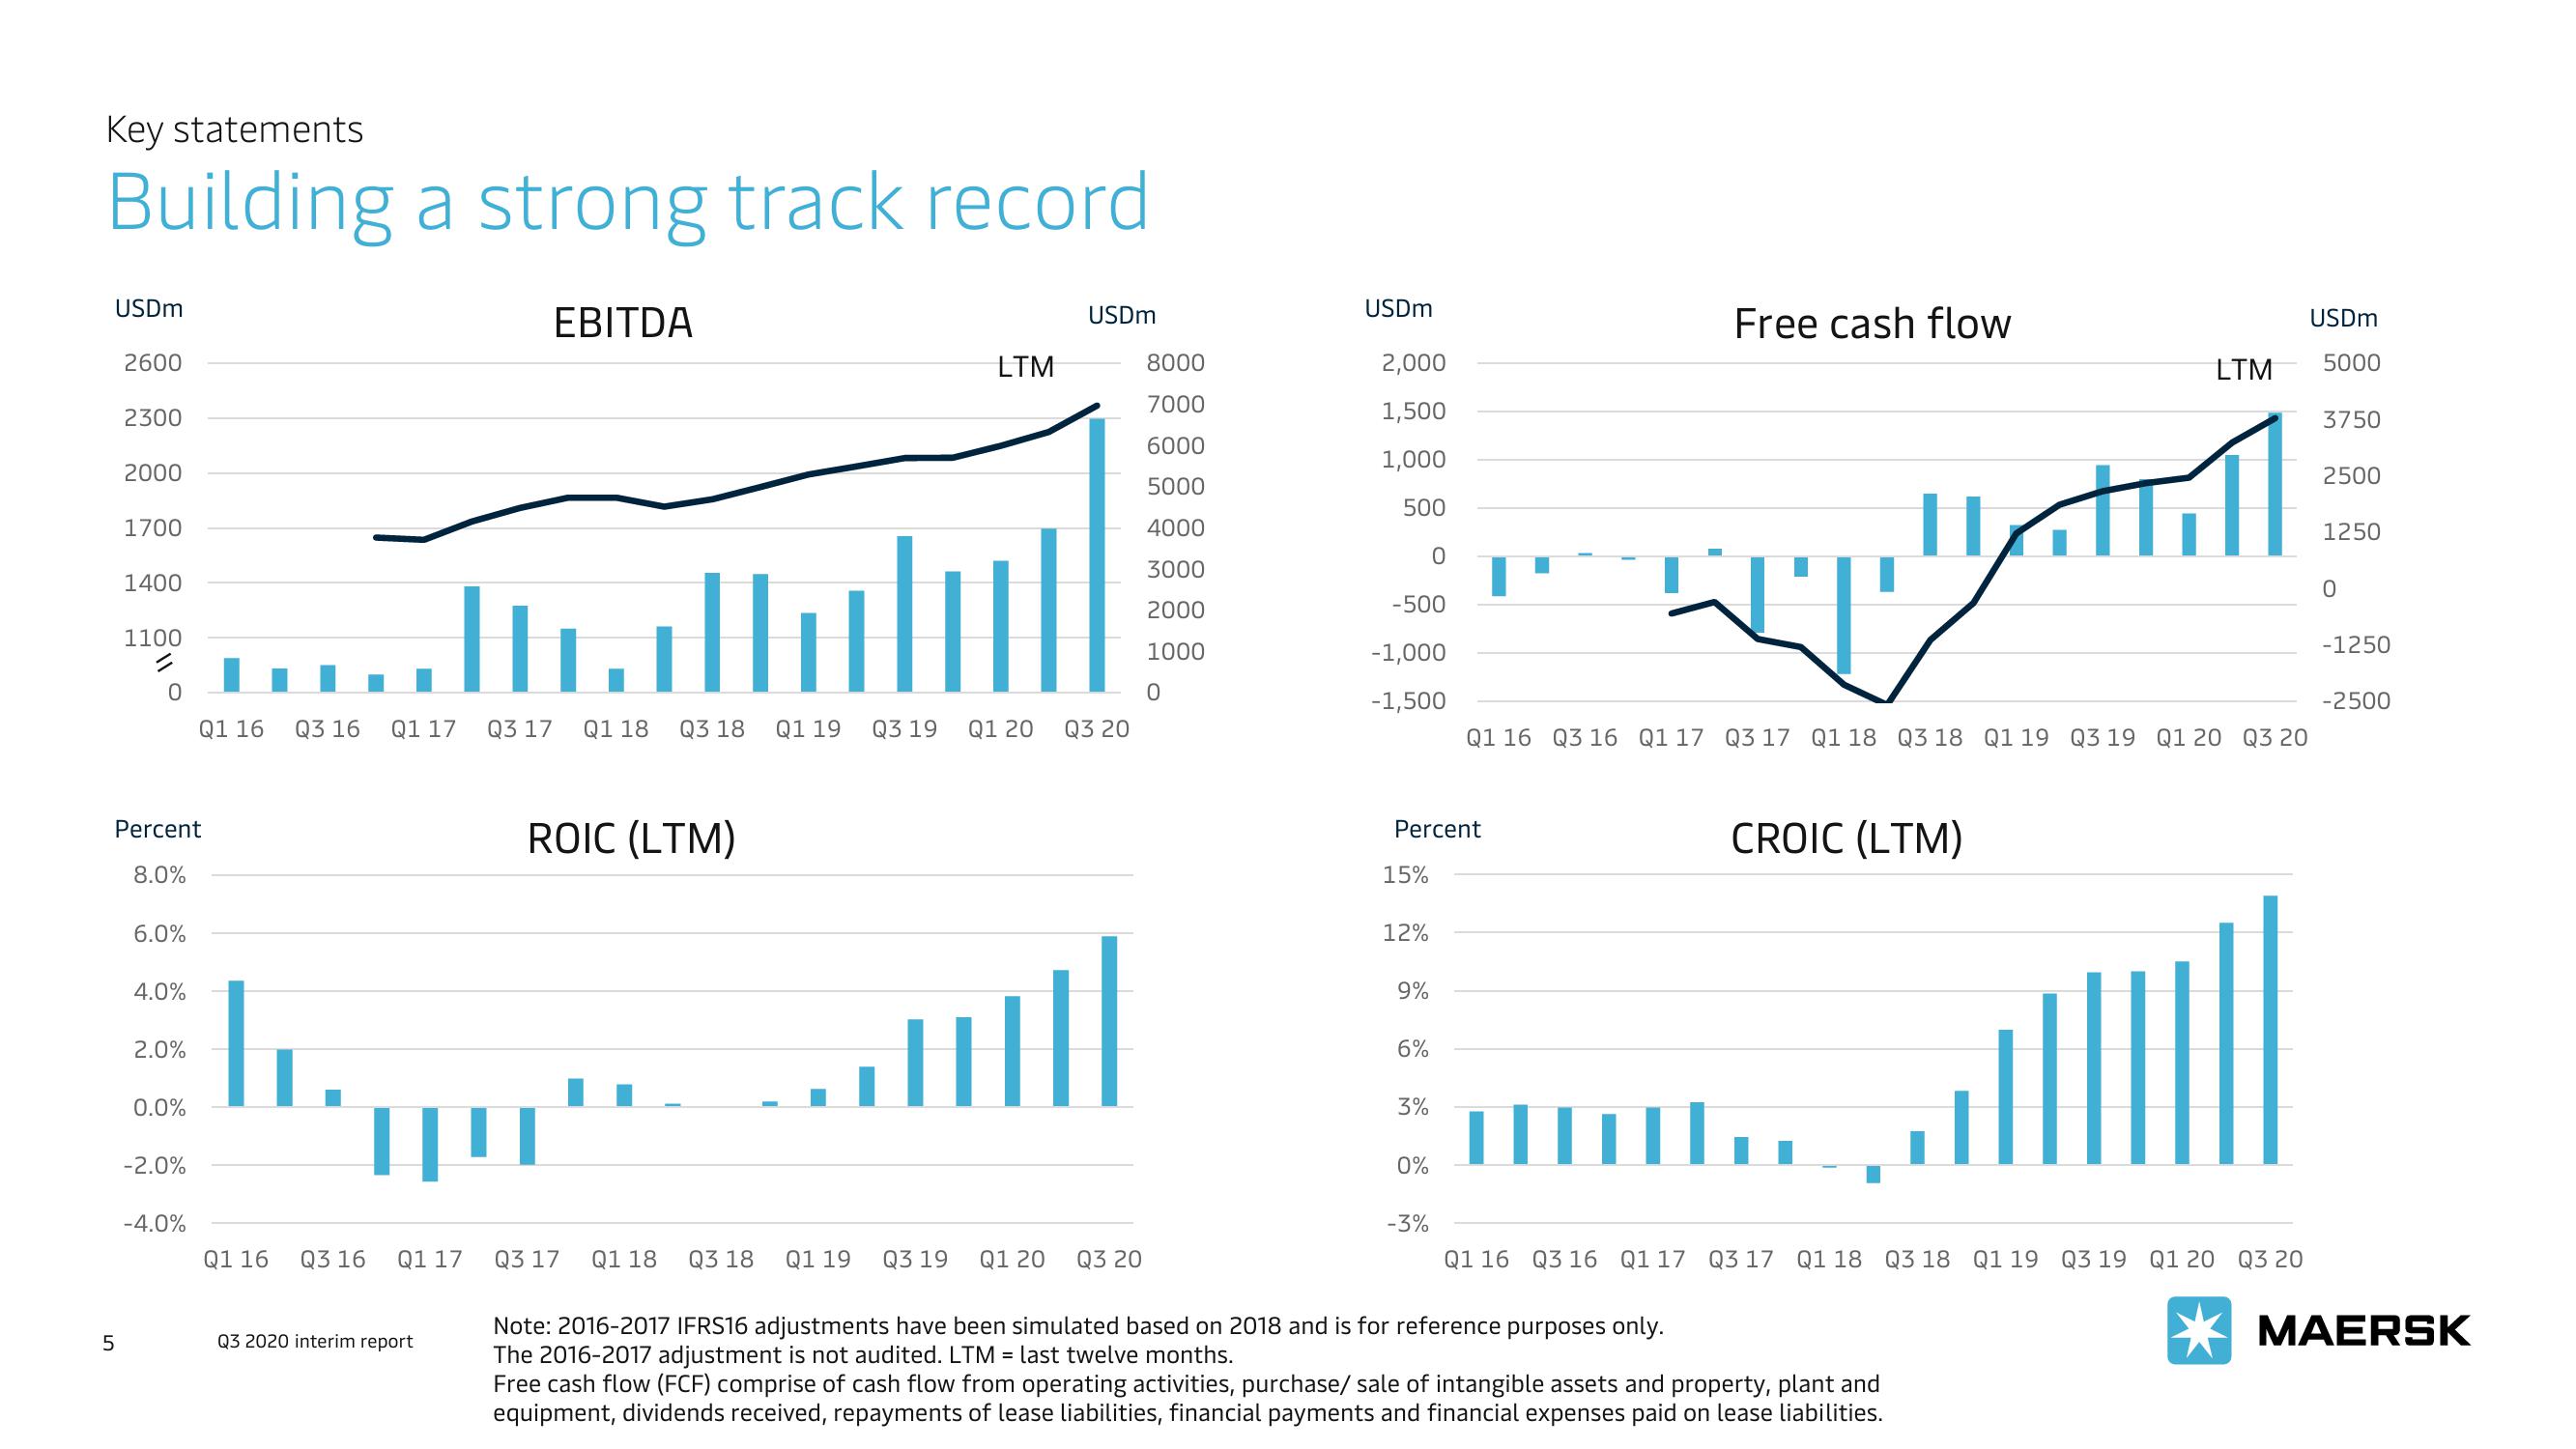
Building a strong track record
USDm
2600
5
2300
2000
1700
1400
1100
2
0
Percent
8.0%
6.0%
4.0%
2.0%
0.0%
-2.0%
-4.0%
Q1 16 Q3 16 Q1 17
EBITDA
alladull
Q1 16 Q3 16 Q1 17 Q3 17 Q1 18 Q3 18 Q1 19 Q3 19 Q1 20 Q3 20
Q3 2020 interim report
LTM
ROIC (LTM)
USDm
Q3 17 Q1 18 Q3 18 Q1 19 Q3 19 Q1 20 Q3 20
8000
7000
6000
5000
4000
3000
2000
1000
0
USDm
2,000
1,500
1,000
500
-500
-1,000
-1,500
15%
Percent
12%
9%
6%
3%
0
0%
-3%
Free cash flow
Q1 16 Q3 16 Q1 17 Q3 17 Q1 18 Q3 18 Q1 19 Q3 19 Q1 20 Q3 20
LTM
wimply till
CROIC (LTM)
Q1 16 Q3 16 Q1 17 Q3 17 Q1 18 Q3 18 Q1 19 Q3 19 Q1 20 Q3 20
Note: 2016-2017 IFRS16 adjustments have been simulated based on 2018 and is for reference purposes only.
The 2016-2017 adjustment is not audited. LTM = last twelve months.
Free cash flow (FCF) comprise of cash flow from operating activities, purchase/ sale of intangible assets and property, plant and
equipment, dividends received, repayments of lease liabilities, financial payments and financial expenses paid on lease liabilities.
USDm
5000
3750
2500
1250
0
-1250
-2500
MAERSKView entire presentation