Inovalon Investor Conference Presentation Deck
Cash Flow From Operations
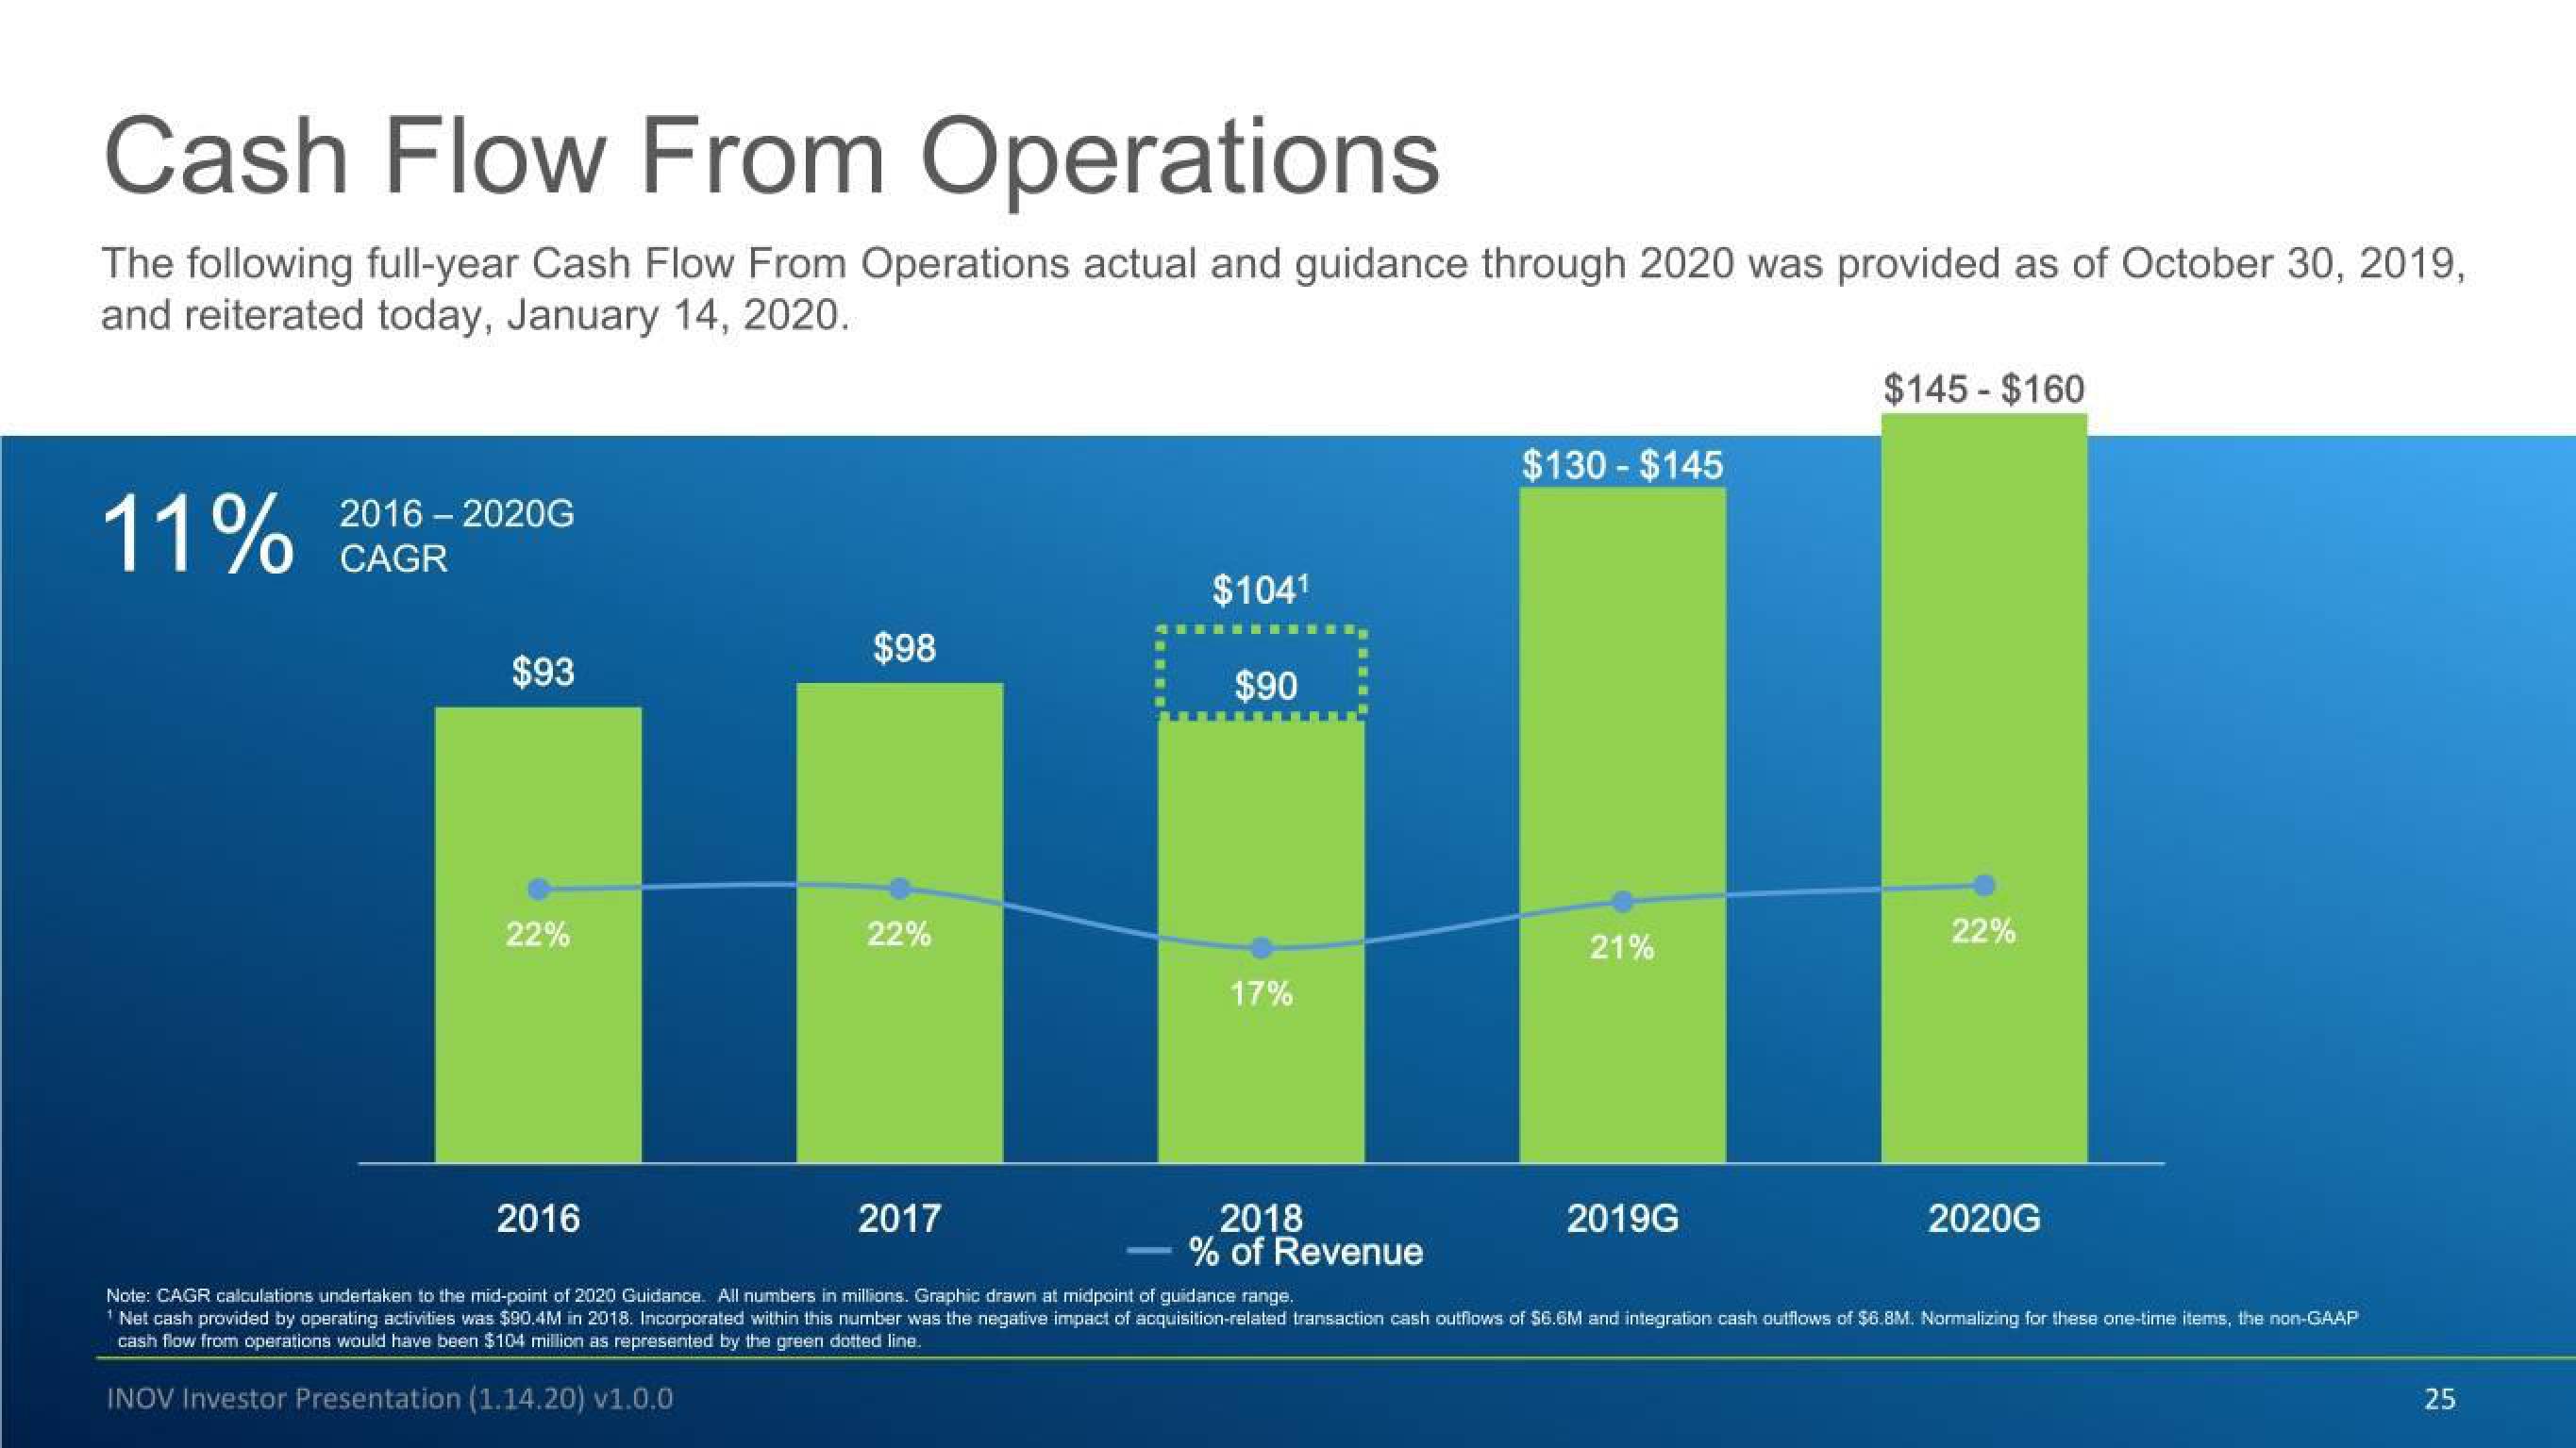
The following full-year Cash Flow From Operations actual and guidance through 2020 was provided as of October 30, 2019,
and reiterated today, January 14, 2020.
11%
2016-2020G
CAGR
$93
22%
2016
$98
22%
2017
$104¹
$90
17%
2018
% of Revenue
$130-$145
21%
2019G
$145 - $160
22%
2020G
Note: CAGR calculations undertaken to the mid-point of 2020 Guidance. All numbers in millions. Graphic drawn at midpoint of guidance range.
¹ Net cash provided by operating activities was $90.4M in 2018. Incorporated within this number was the negative impact of acquisition-related transaction cash outflows of $6.6M and integration cash outflows of $6.8M. Normalizing for these one-time items, the non-GAAP
cash flow from operations would have been $104 million as represented by the green dotted line.
INOV Investor Presentation (1.14.20) v1.0.0
25View entire presentation